Module 2: Logging with LokiStack
After implementing user workload monitoring in Module 1, you now need to address log management challenges. While metrics show when issues occur, investigating root causes requires efficient log analysis across distributed services.
Your organization runs a distributed application with 12+ microservices. When issues occur, developers currently access individual pod logs manually. This process is time-consuming and error-prone, especially when correlating events across multiple services.
In this module, you’ll implement centralized logging with LokiStack and learn to write LogQL queries that quickly surface relevant log entries across your entire application.
Learning objectives
By the end of this module, you’ll be able to:
-
Understand LokiStack architecture and how it differs from traditional logging solutions
-
Configure ClusterLogForwarder to send application logs to Loki
-
Write LogQL queries to search and filter logs across multiple services
-
Correlate logs with metrics to accelerate troubleshooting
-
Create log-based alerts for critical application events
Understanding LokiStack architecture
Before configuring logging, you need to understand how LokiStack works and why it’s efficient for Kubernetes environments.
What is Loki?
Loki is a horizontally scalable, highly available log aggregation system inspired by Prometheus. Unlike traditional logging systems that index the full text of log messages, Loki only indexes metadata (labels) and stores log content separately.
Key differences from traditional logging:
-
Traditional (Elasticsearch): Indexes every word in every log message → high storage cost, slower writes
-
Loki: Indexes only labels (namespace, pod, container) → lower storage cost, faster writes, efficient for Kubernetes
LokiStack components:
-
Distributor: Receives log streams from clients
-
Ingester: Writes logs to storage and serves recent queries
-
Querier: Handles LogQL queries against stored logs
-
Compactor: Maintains index and deletes expired logs
Log forwarding flow
In OpenShift, logs flow through this pipeline:
-
Application writes logs to stdout/stderr
-
Container runtime captures logs to node filesystem
-
OpenShift Logging Operator’s collector pods read logs
-
ClusterLogForwarder routes logs to LokiStack
-
Loki stores logs with labels for querying
You’ll configure the ClusterLogForwarder to ensure application logs reach Loki.
Exercise 1: Verify logging infrastructure
You need to verify that the logging stack was deployed via GitOps and is ready to receive logs.
The LokiStack instance and logging operator were pre-configured, so you’ll confirm the components are running.
Steps
-
Log into the OpenShift console at OpenShift Console (if not already logged in)
-
Verify the logging operator is running:
oc get pods -n openshift-loggingExpected outputNAME READY STATUS RESTARTS AGE cluster-logging-operator-xxxxx 1/1 Running 0 1h collector-xxxxx 2/2 Running 0 1h collector-xxxxx 2/2 Running 0 1h logging-loki-compactor-0 1/1 Running 0 1h logging-loki-distributor-xxxxx 1/1 Running 0 1h logging-loki-gateway-xxxxx 2/2 Running 0 1h logging-loki-index-gateway-0 1/1 Running 0 1h logging-loki-ingester-0 1/1 Running 0 1h logging-loki-querier-xxxxx 1/1 Running 0 1h logging-loki-query-frontend-xxxxx 1/1 Running 0 1h -
Check the LokiStack instance:
oc get lokistack -n openshift-logging logging-loki -o custom-columns=Name:metadata.name,Size:.spec.sizeExpected outputName Size logging-loki 1x.extra-smallThe status should be Ready.
-
Verify the ClusterLogForwarder configuration:
oc get clusterlogforwarder -n openshift-logging instance -o custom-columns=Name:metadata.name,Outputs:.spec.outputs[0].nameExpected outputName Outputs instance lokistack -
View the ClusterLogForwarder configuration:
oc get clusterlogforwarder -n openshift-logging instance -o json| jq .specLook for pipelines that forward application and infrastructure logs to the default output (LokiStack).
Verify
Check that your logging infrastructure is operational:
-
✓ Logging operator pod is Running
-
✓ Collector pods are Running on each node
-
✓ LokiStack components (distributor, ingester, querier) are Running
-
✓ LokiStack status is Ready
-
✓ ClusterLogForwarder exists with pipelines configured
What you learned: OpenShift Logging uses a collector (based on Vector) to gather logs from all pods and forward them to LokiStack according to ClusterLogForwarder rules.
Troubleshooting
Issue: LokiStack status shows "Degraded" or "Pending"
Solution:
. Check LokiStack pods for errors: oc get pods -n openshift-logging | grep loki
. Describe the LokiStack: oc describe lokistack logging-loki -n openshift-logging
. If reason is MissingObjectStorageSecret, check sync Job status:
+
oc get job logging-loki-s3-secret-sync -n openshift-logging
oc logs job/logging-loki-s3-secret-sync -n openshift-logging-
Check for storage issues:
oc get pvc -n openshift-logging -
Verify storage class exists:
oc get storageclass
Issue: No collector pods running
Solution:
. Check DaemonSet status: oc get daemonset -n openshift-logging
. View collector logs: oc logs -n openshift-logging -l app.kubernetes.io/component=collector --tail=100
. Verify ClusterLogForwarder resource exists: oc get clusterlogforwarder -n openshift-logging
Issue: ClusterLogForwarder not found
Solution: The logging stack may not be fully configured. Check that the GitOps deployment completed successfully.
Exercise 2: Generate application logs
To practice querying logs, you need an application that generates diverse log entries. In this exercise, you’ll deploy a simple three-service Go application:
-
frontendreceives HTTP requests and forwards them tobackend -
backendwrites request events todatabase -
databaseexposes a REST API backed by persistent ChaiSQL storage on disk
Each service writes structured request logs to stdout, which Loki collects.
The manifest also deploys a k6 load generator that starts automatically once the frontend is healthy. It runs continuously in the background, sending ~10–60 req/s of realistic traffic (pings, note reads/writes, and intentional 404 errors) so your dashboards and queries always have data to work with — no manual traffic generation required.
Steps
-
Deploy the logging demo application manifest from GitHub:
NAMESPACE="%OPENSHIFT_USERNAME%-observability-demo" curl -sL https://raw.githubusercontent.com/cldmnky/observability-workshop/main/src/deploy.yaml \ | sed "s/__NAMESPACE__/${NAMESPACE}/g" \ | oc apply -f - -
Wait for the deployments to roll out:
oc rollout status deployment/frontend -n %OPENSHIFT_USERNAME%-observability-demo
oc rollout status deployment/backend -n %OPENSHIFT_USERNAME%-observability-demo
oc rollout status statefulset/database -n %OPENSHIFT_USERNAME%-observability-demo
oc rollout status deployment/loadgenerator -n %OPENSHIFT_USERNAME%-observability-demo
The application images are pre-built and hosted on
quay.io/cldmnky/observability/. Pods should start within a minute or two. The load generator uses an init container to wait for the frontend to be healthy before it starts sending traffic. -
Verify all deployments are running, including the load generator:
oc get pods -n %OPENSHIFT_USERNAME%-observability-demo -l app=frontend oc get pods -n %OPENSHIFT_USERNAME%-observability-demo -l app=backend oc get pods -n %OPENSHIFT_USERNAME%-observability-demo -l app=database oc get pods -n %OPENSHIFT_USERNAME%-observability-demo -l app=loadgenerator -
Verify the frontend Route and open the UI:
oc get route frontend -n %OPENSHIFT_USERNAME%-observability-demo FRONTEND_HOST=$(oc get route frontend -n %OPENSHIFT_USERNAME%-observability-demo -o jsonpath='{.spec.host}') echo "https://${FRONTEND_HOST}" -
Open the frontend URL in your browser, create at least two workshop notes, and click Export Markdown.
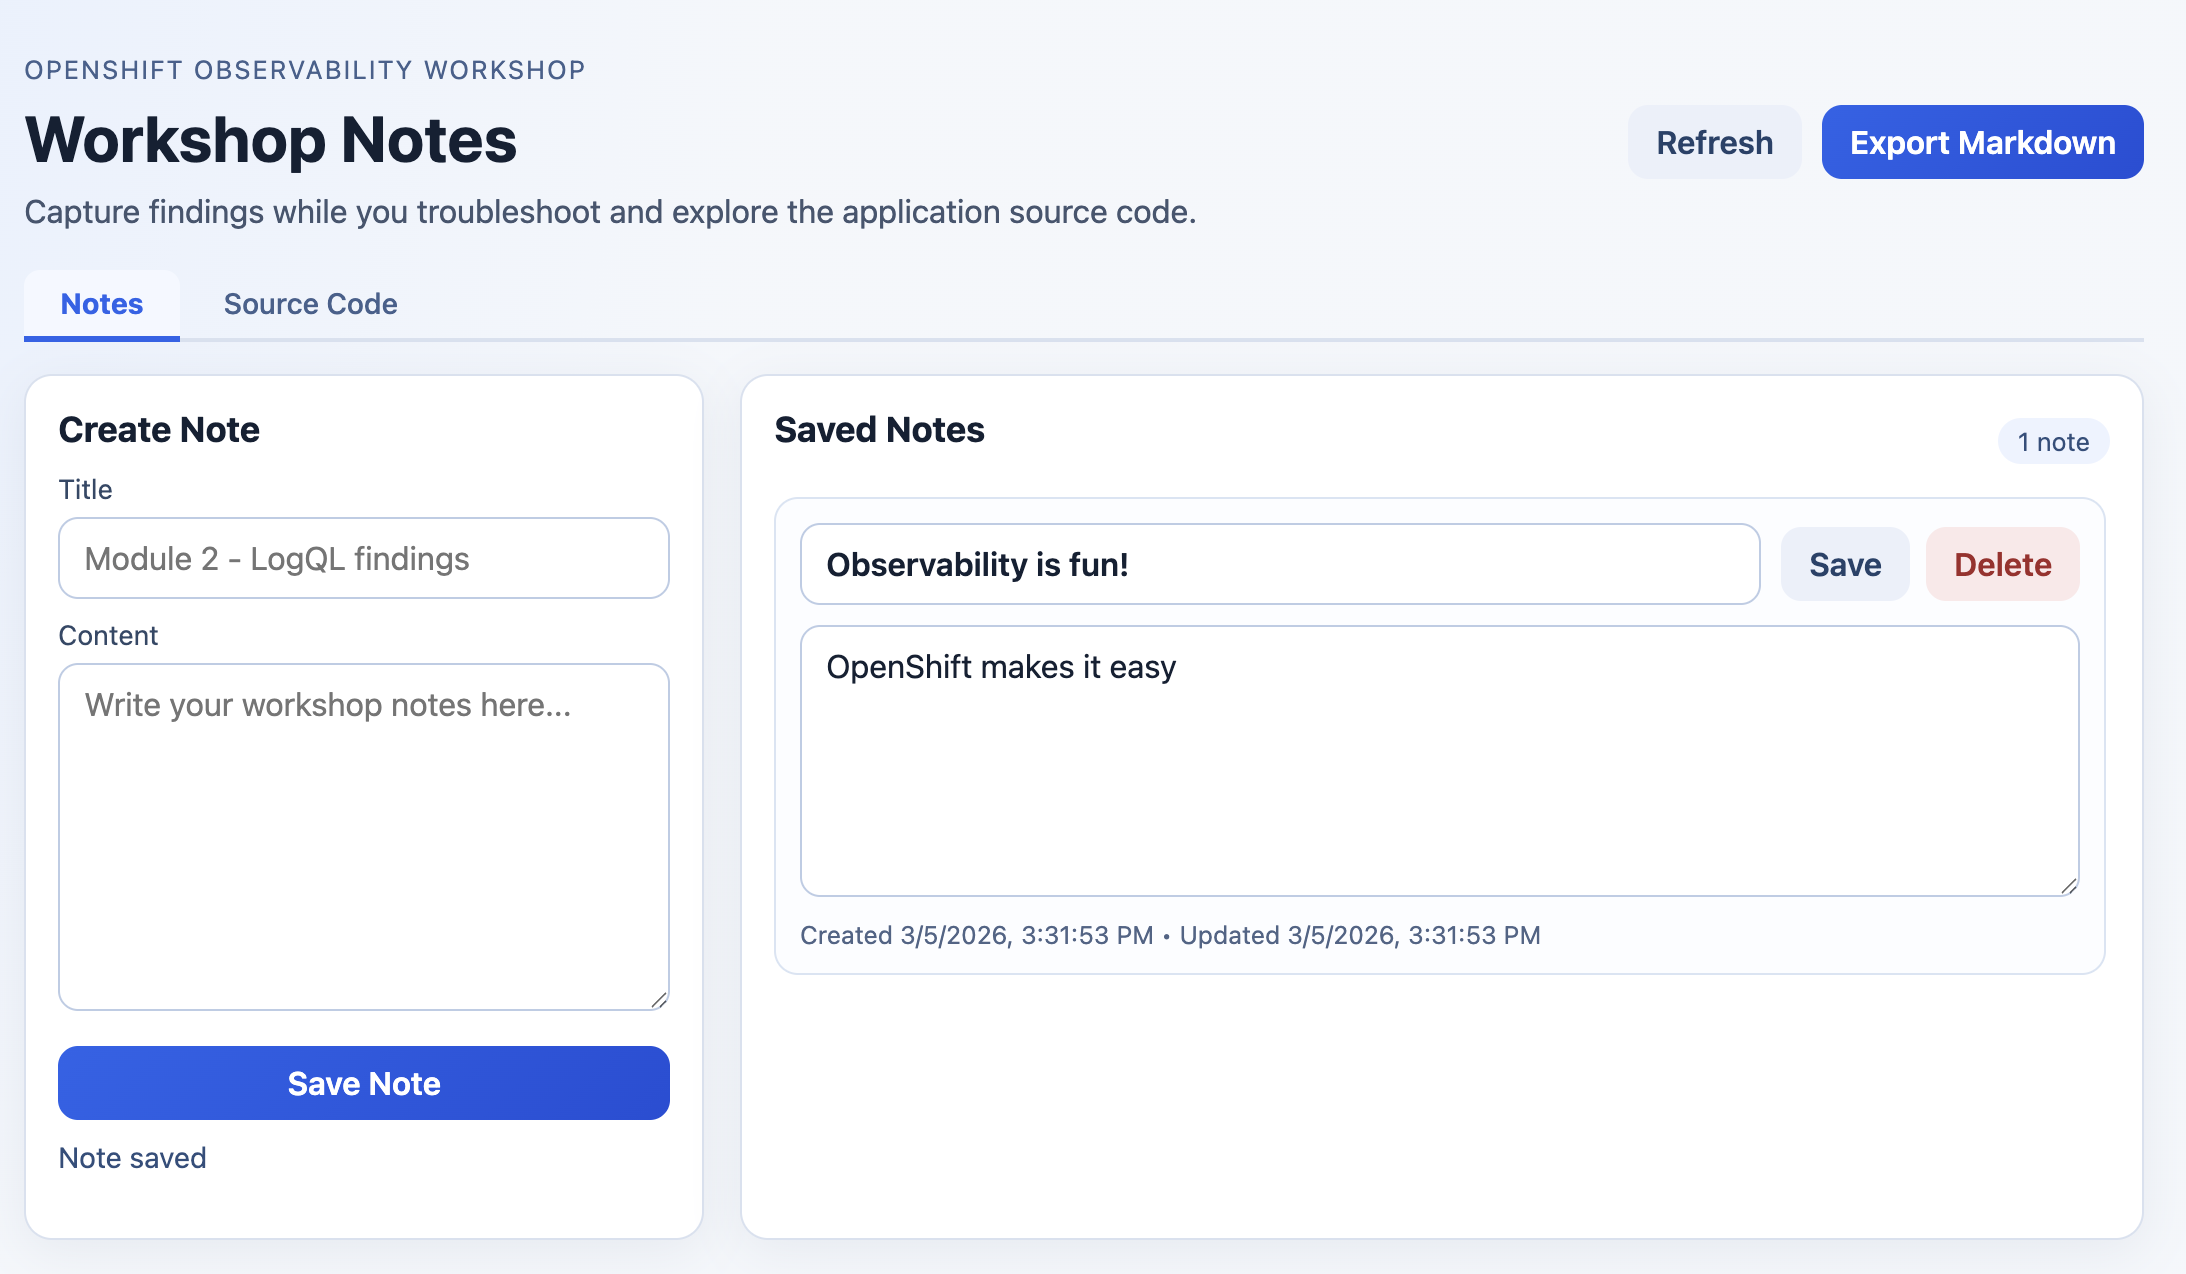
The exported file (
workshop-notes.md) confirms notes are persisted and downloadable from the frontend. -
Confirm the load generator is producing traffic by checking its logs:
oc logs -n %OPENSHIFT_USERNAME%-observability-demo deployment/loadgenerator --tail=20You should see k6 output showing iteration counts and request results. The load generator runs ~10–60 req/s continuously, mixing successful requests with intentional 404 errors — so logs, metrics, and traces are populated immediately.
-
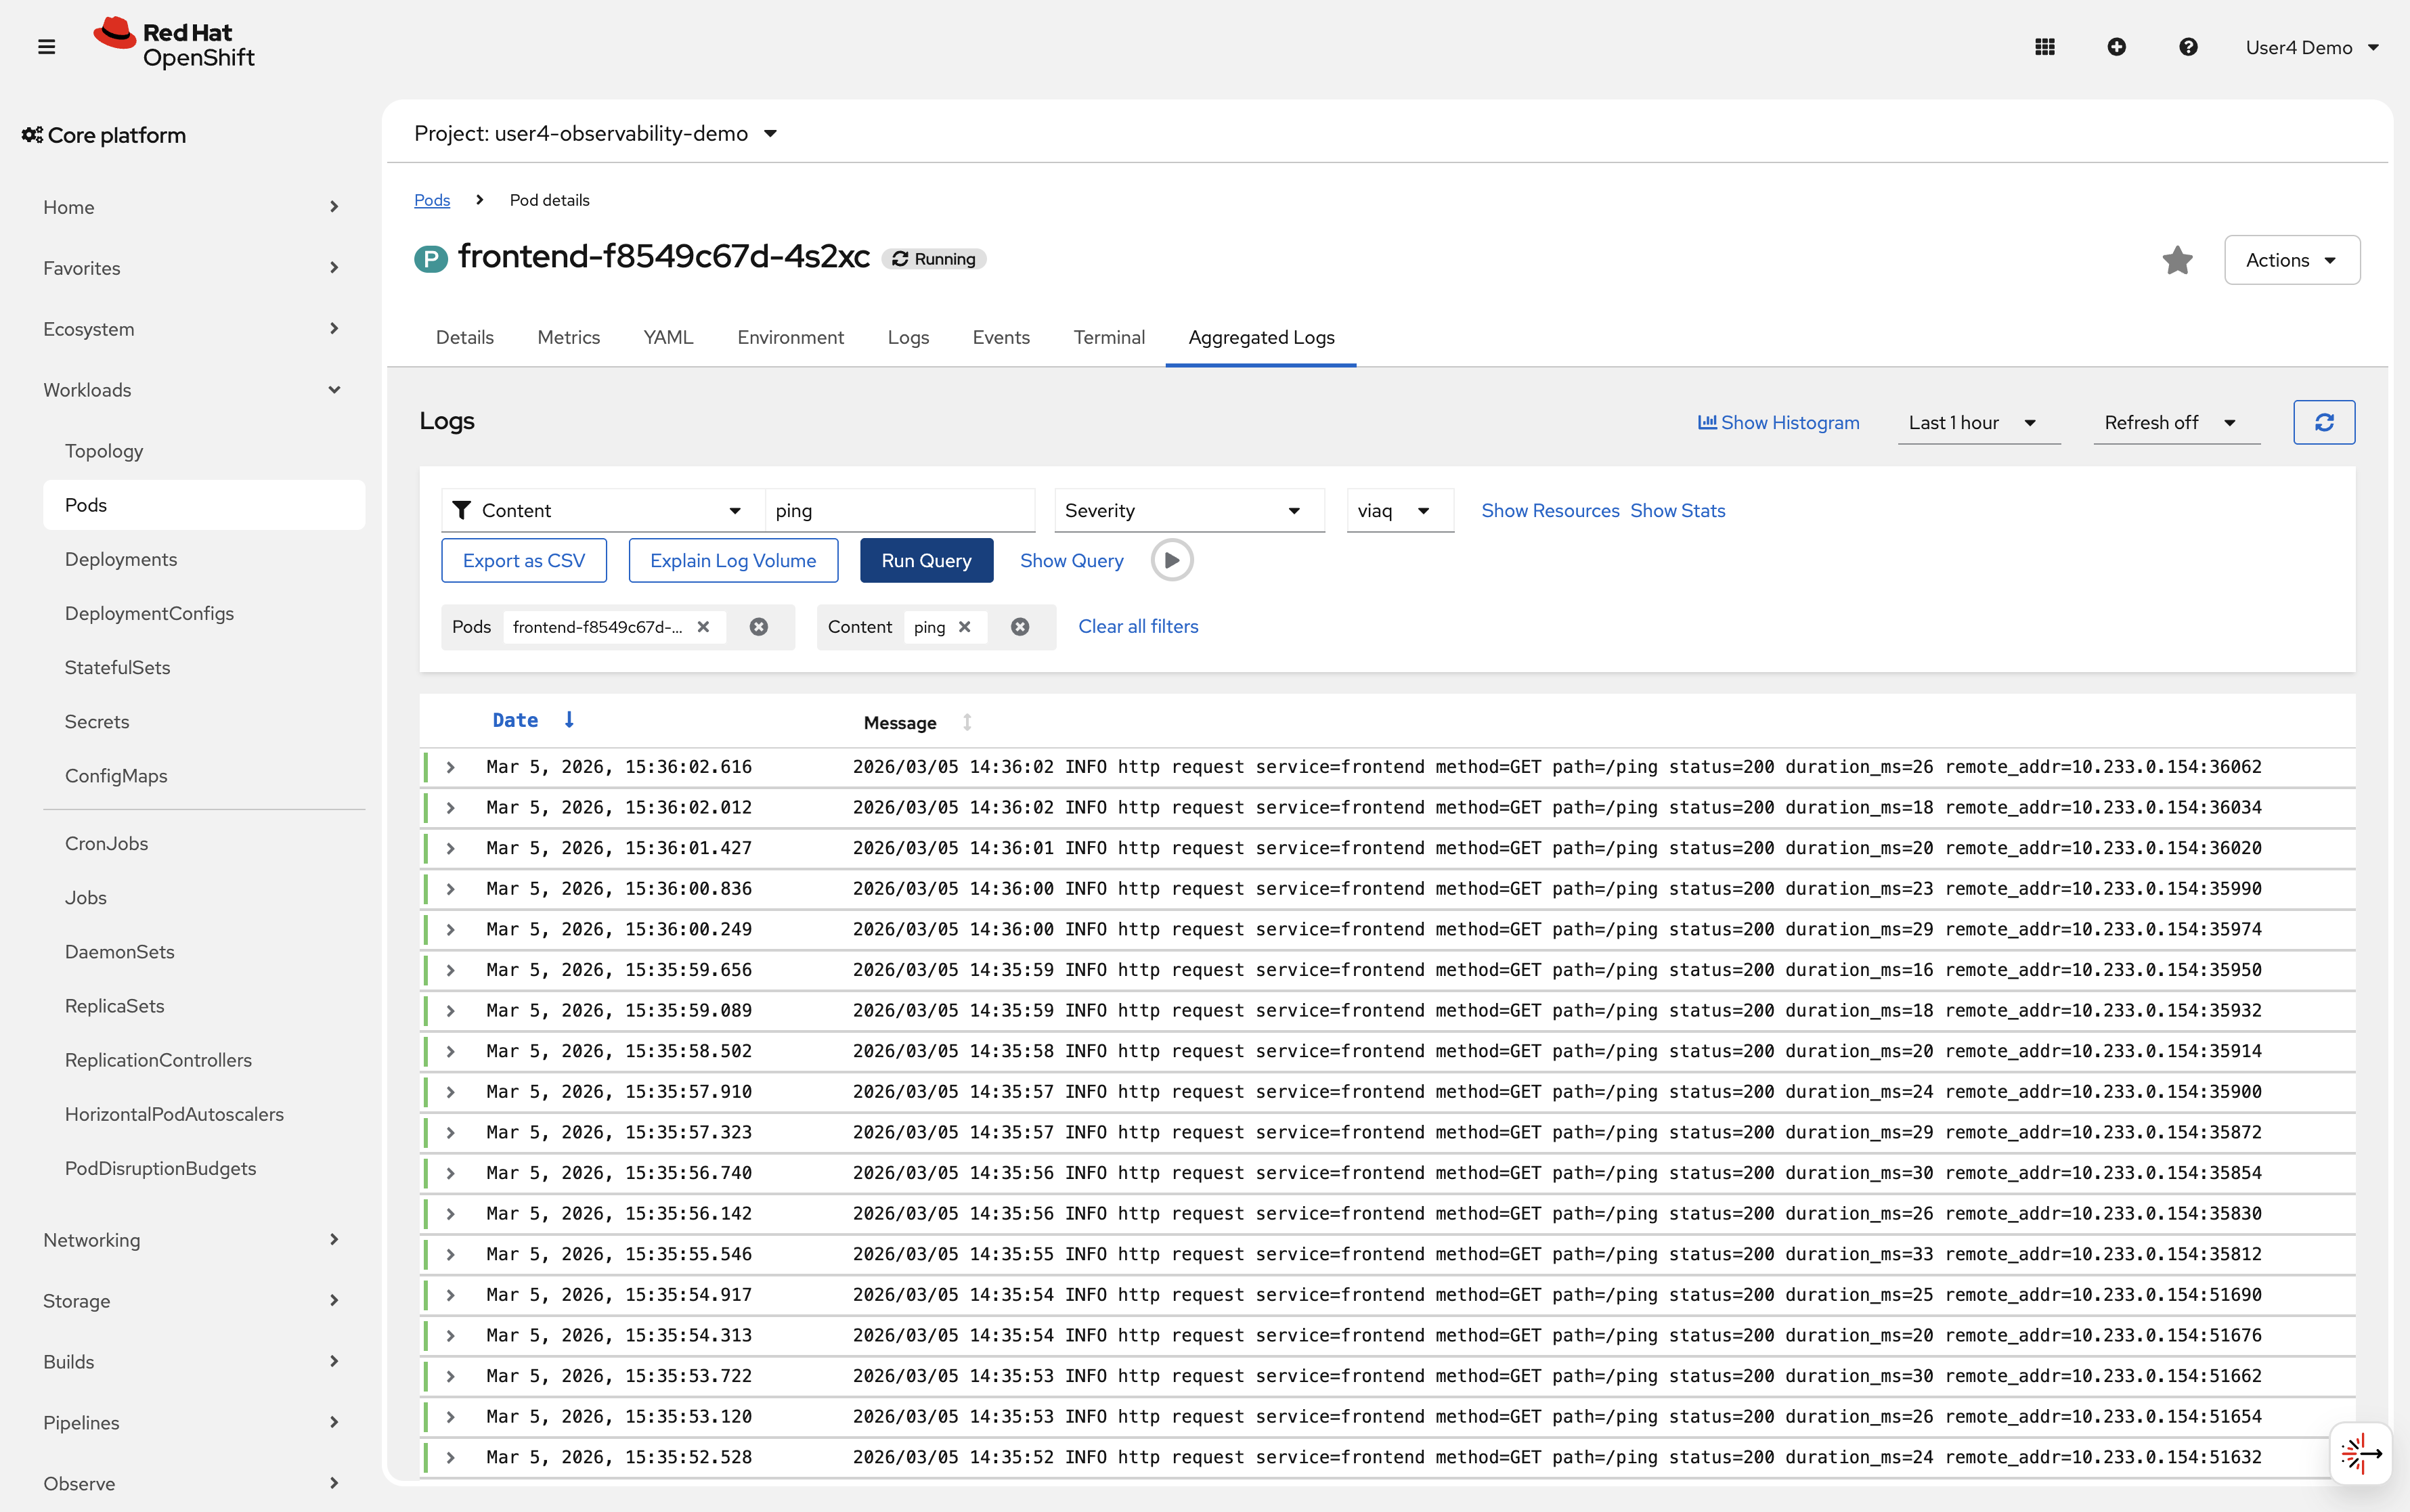
View logs from each tier to see request traces:
oc logs -n %OPENSHIFT_USERNAME%-observability-demo deployment/frontend --tail=20
oc logs -n %OPENSHIFT_USERNAME%-observability-demo deployment/backend --tail=20
oc logs -n %OPENSHIFT_USERNAME%-observability-demo statefulset/database --tail=20
Sample output2026/02/11 10:23:14 service=frontend method=POST path=/api/notes status=201 duration_ms=5 2026/02/11 10:23:15 service=frontend method=GET path=/ping status=200 duration_ms=3 2026/02/11 10:23:16 service=frontend method=GET path=/error status=404 duration_ms=4 2026/02/11 10:23:14 service=backend method=POST path=/api/notes status=201 duration_ms=3 2026/02/11 10:23:16 service=backend method=GET path=/api/error status=404 duration_ms=2 2026/02/11 10:23:14 service=database method=POST path=/notes status=201 duration_ms=1 2026/02/11 10:23:16 service=database method=POST path=/events status=201 duration_ms=1Open the console and navigate to Workloads → Pods → Aggregated Logs to see logs from all pods in the namespace.
Verify
Check that logs are being generated:
-
✓
frontendlogs include/ping(200) and/not-found(404) from the load generator -
✓
backendlogs show forwarded note create and read requests -
✓
databaselogs show persisted/eventsAPI calls -
✓
loadgeneratorpod is running and its logs show k6 iteration output -
✓ Frontend Route is reachable and serves the notes UI
-
✓ Notes can be exported from the frontend as
workshop-notes.md -
✓ Logs visible via
oc logscommand -
✓ All five pods are running in the
%OPENSHIFT_USERNAME%-observability-demonamespace
What you learned: Applications write logs to stdout/stderr, which OpenShift captures and forwards to your logging backend. Multiple services can run in the same namespace.
Exercise 3: Query logs with LogQL
Now you’ll access the console’s Observe/Logs web interface and write LogQL queries to search logs across all your applications.
LogQL is Loki’s query language, similar to PromQL but for logs instead of metrics.
Steps
-
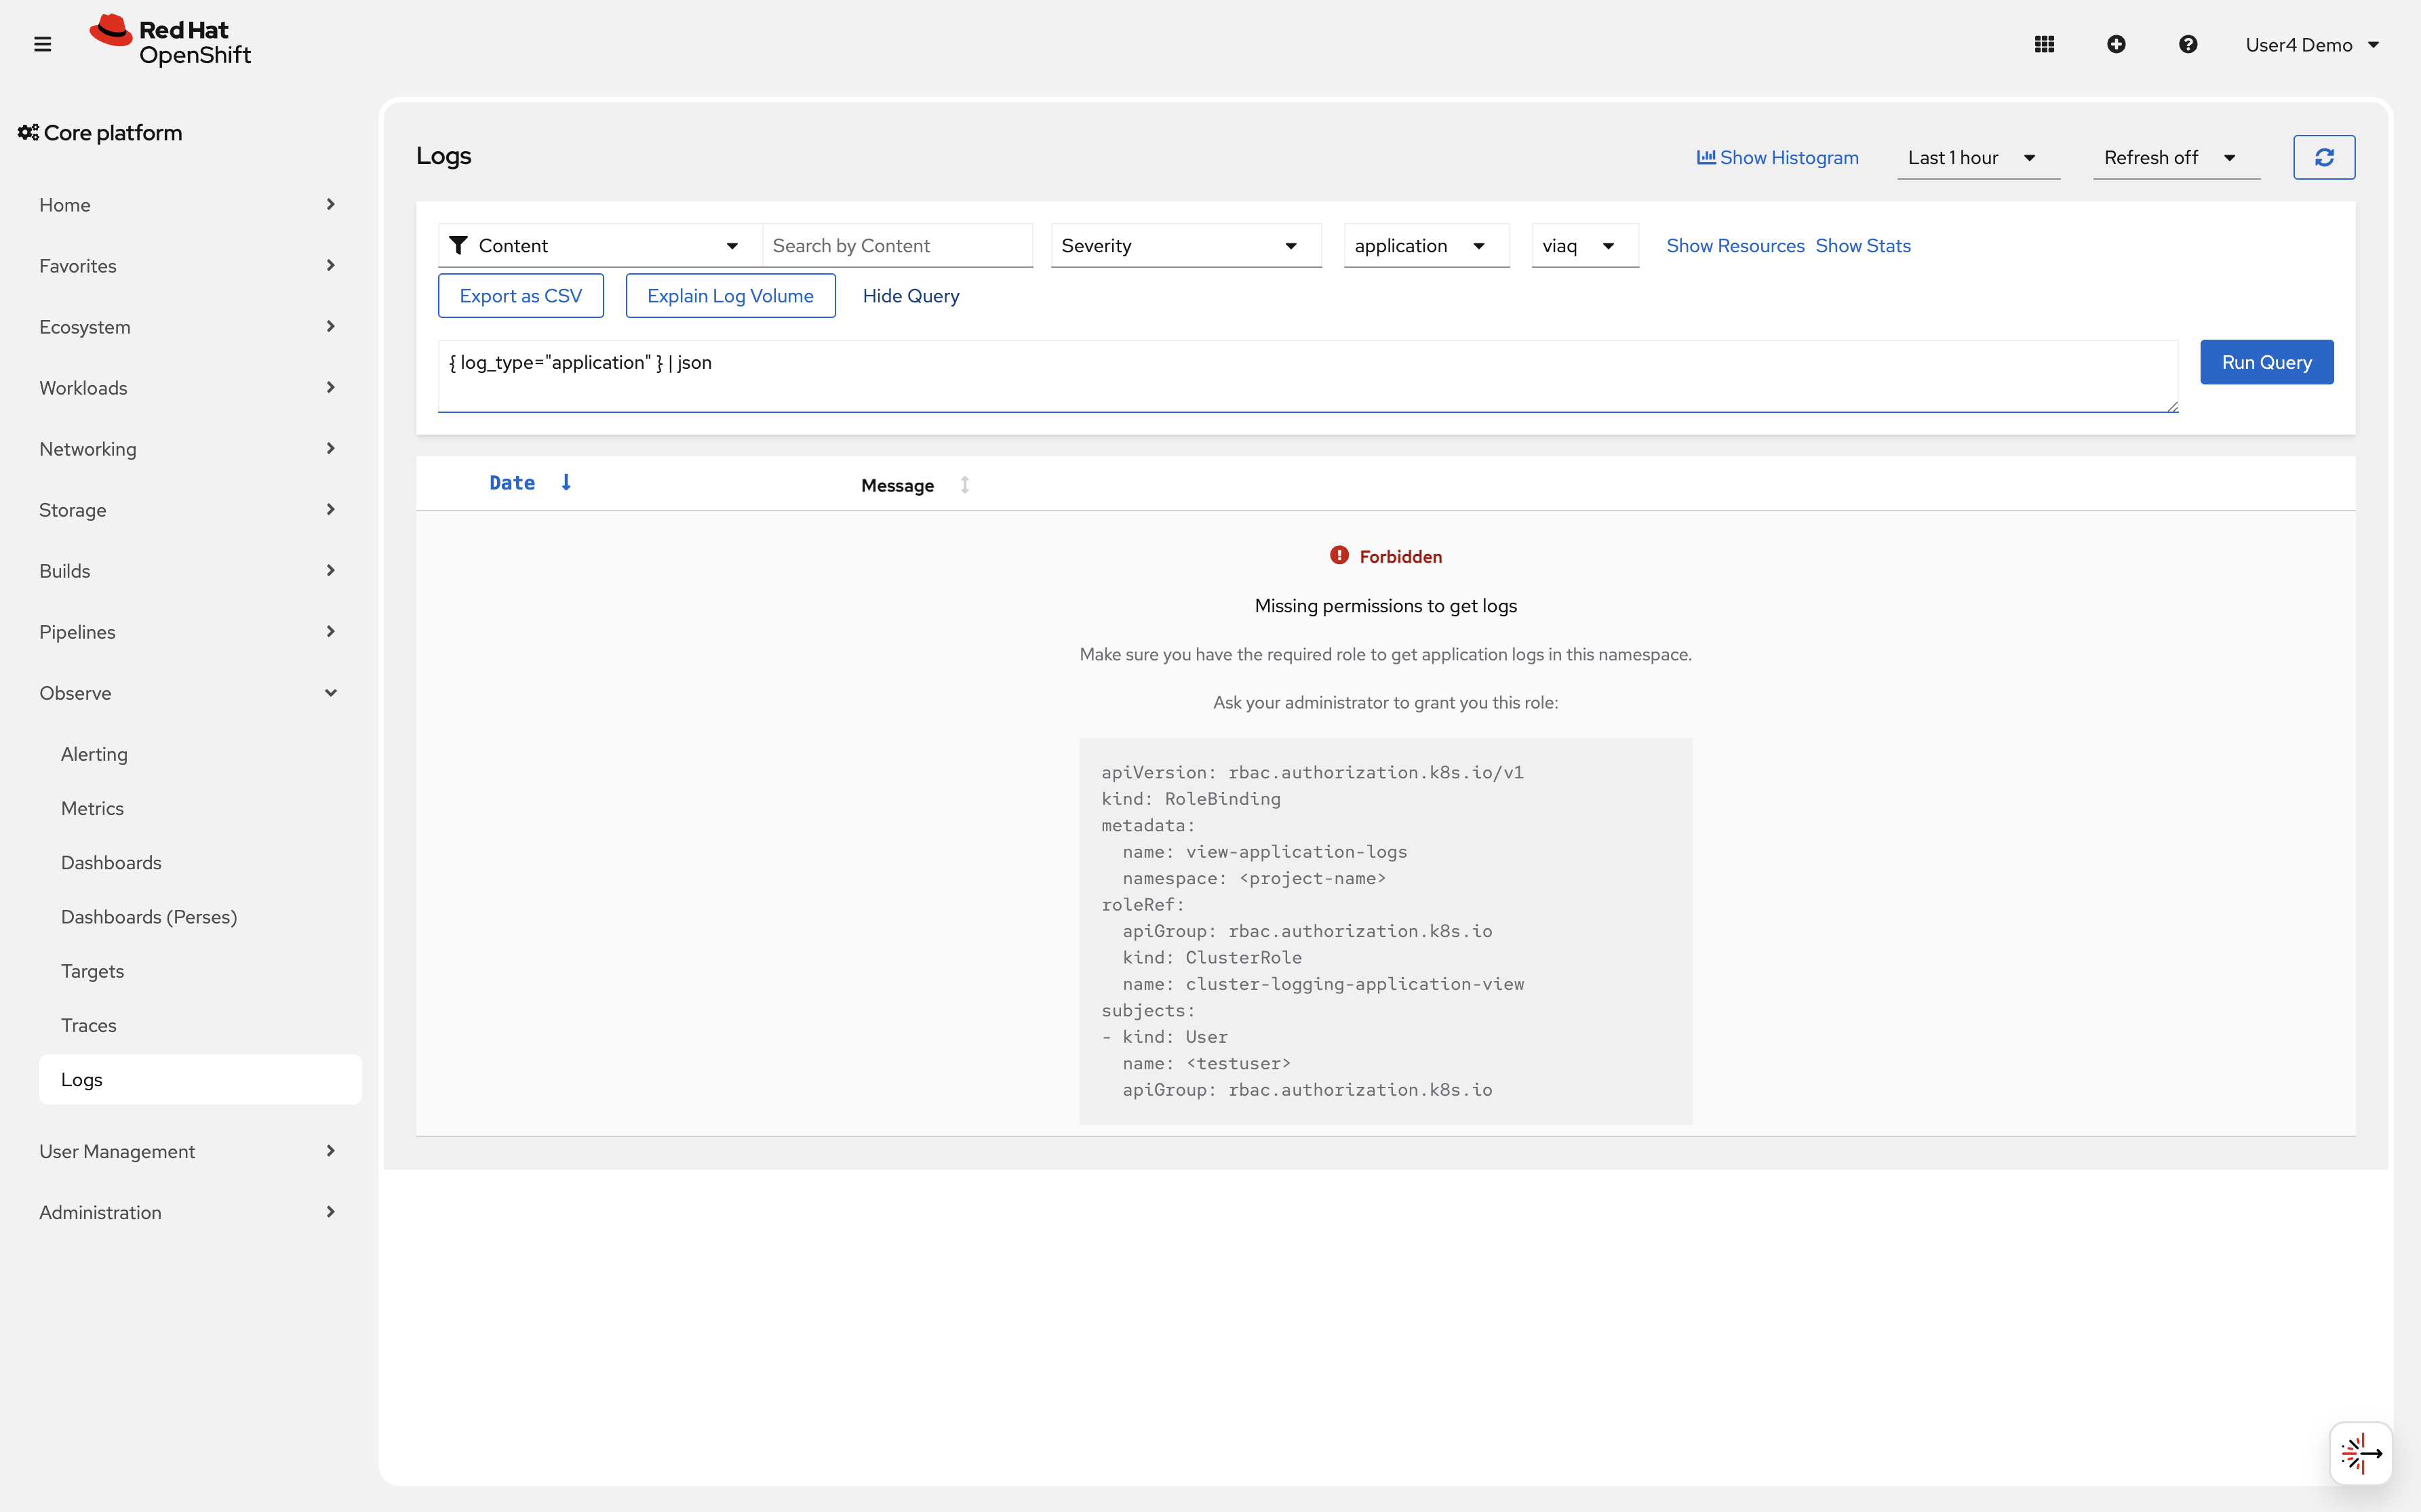
Access the OpenShift console and navigate to Observe → Logs
This opens the log query interface powered by Loki.
|
The Logs interface will display a warning saying "Forbidden: Missing permissions to get logs". This is expected and can be ignored, as the query interface will still work for Loki queries. |
Click on the "show query" button to open the LogQL query editor
-
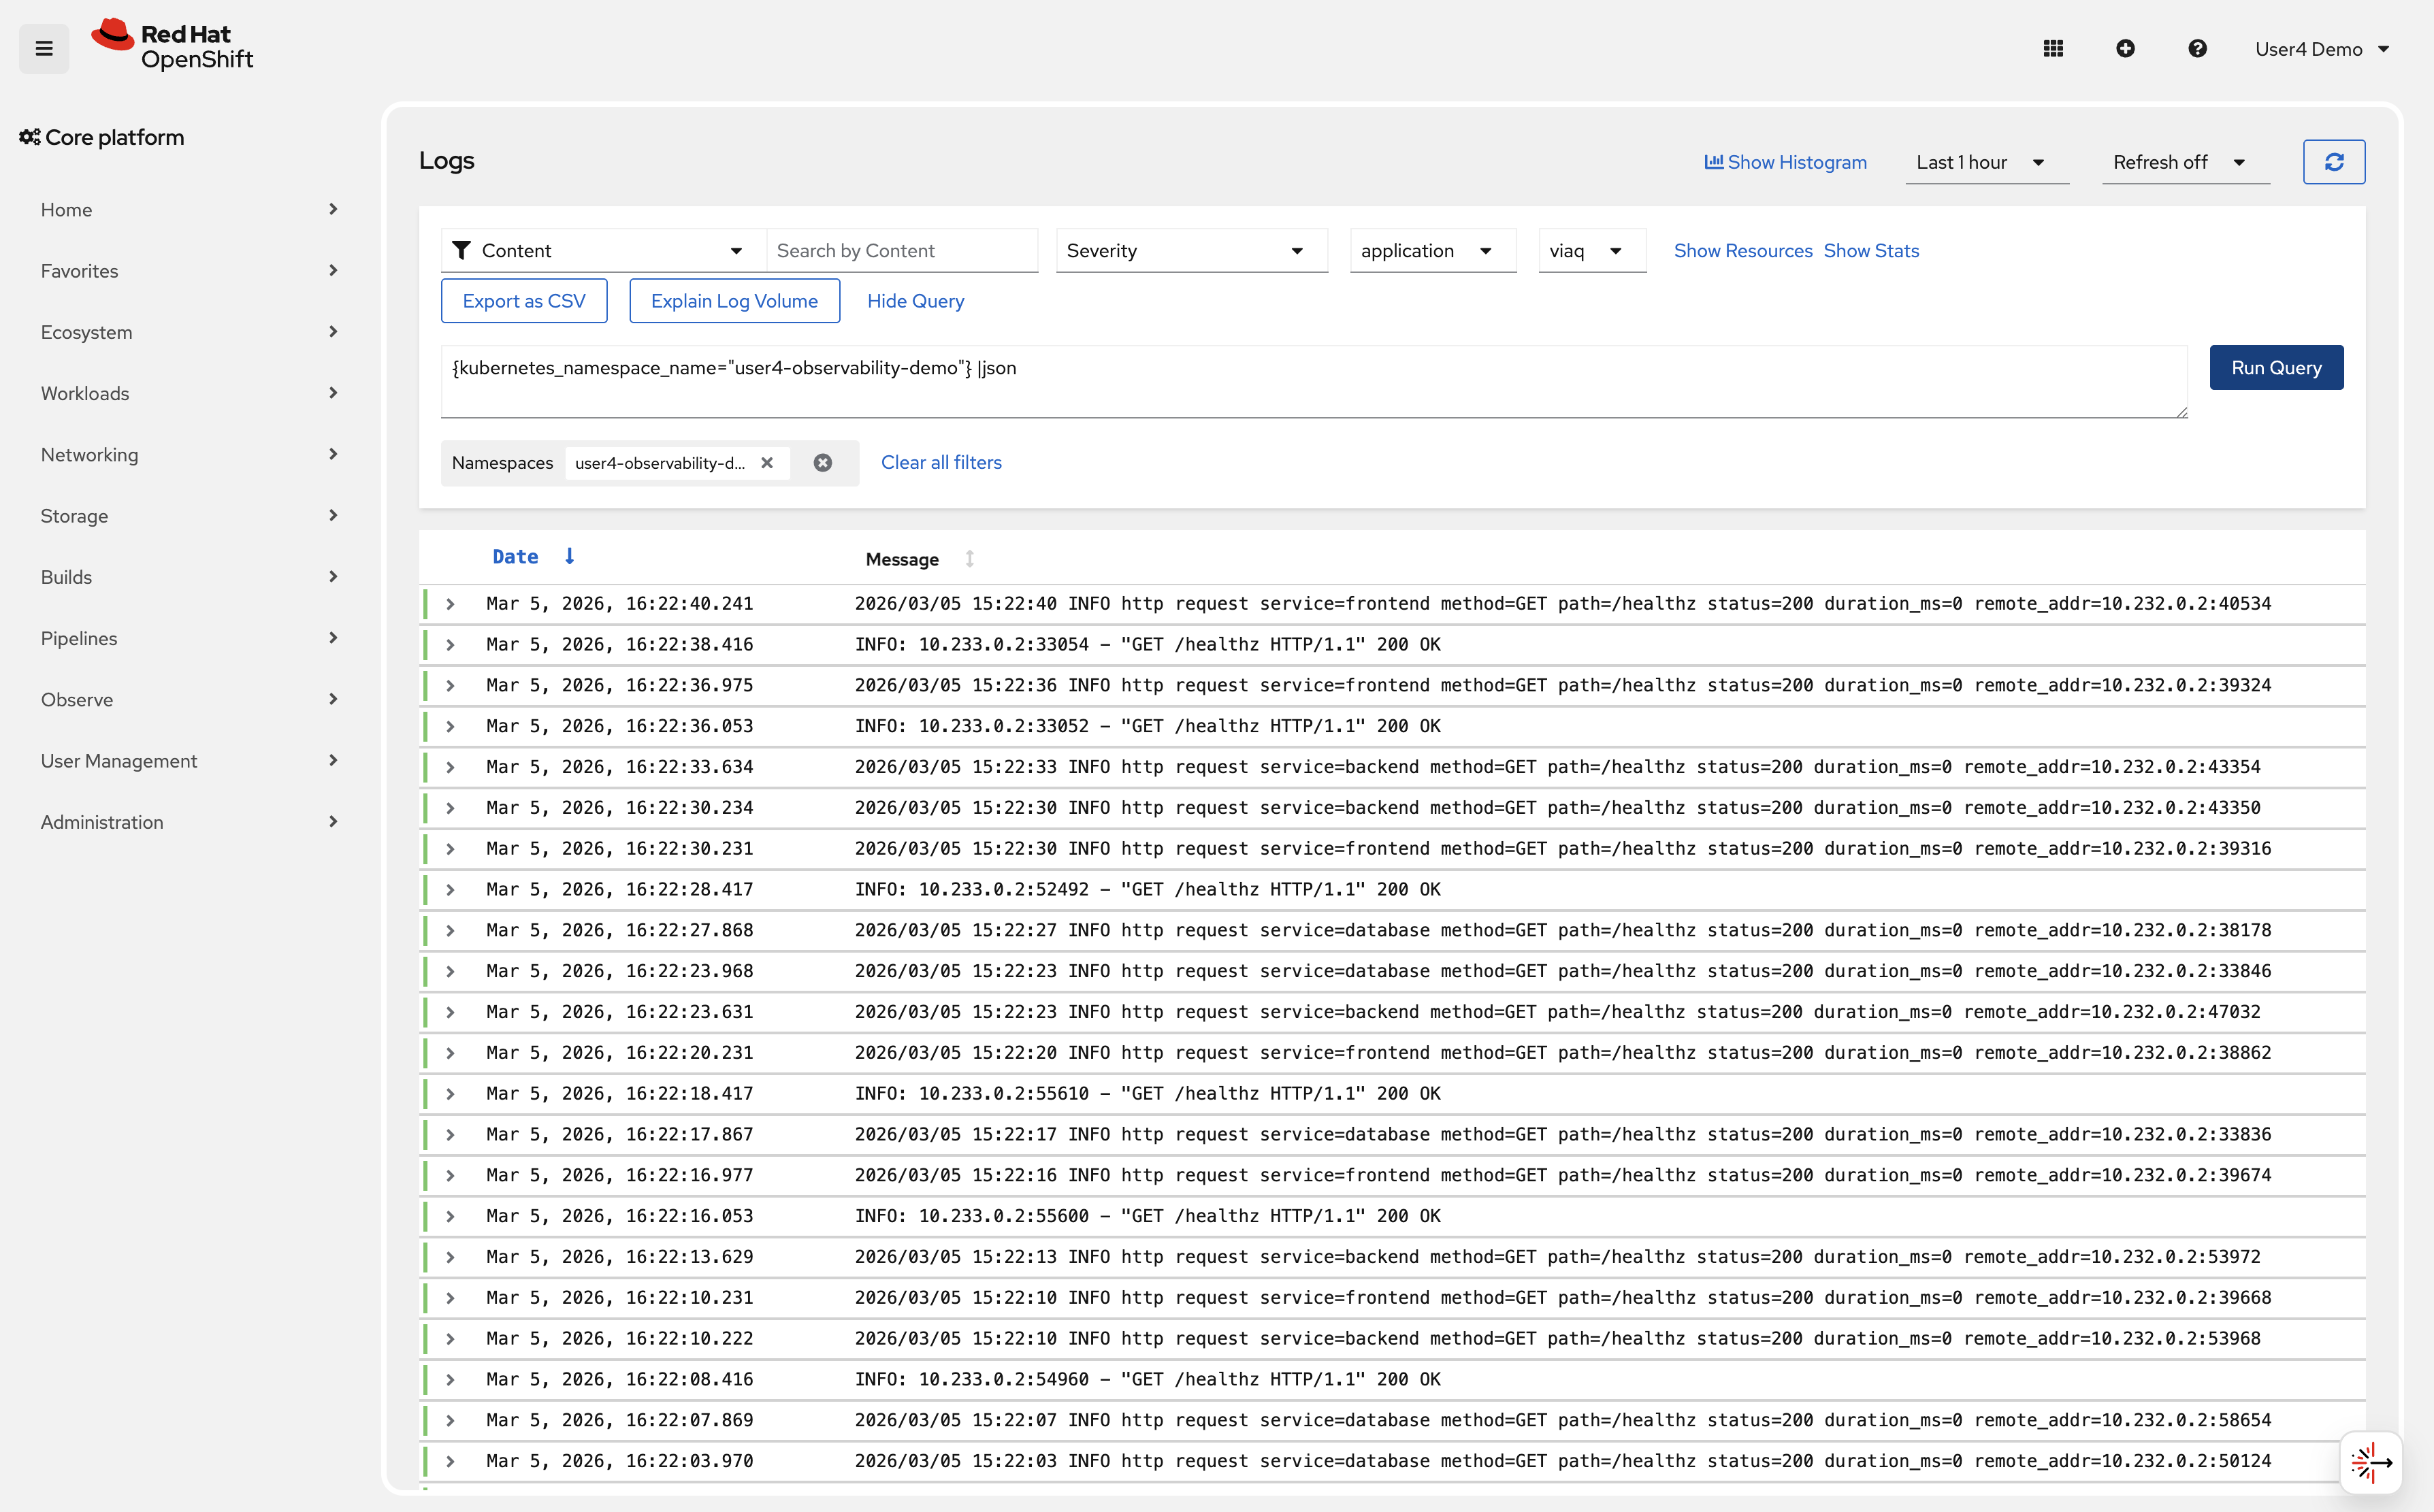
Write your first LogQL query to see all logs from your namespace:
{kubernetes_namespace_name="%OPENSHIFT_USERNAME%-observability-demo"} |jsonClick Run query
You should see log entries from all pods in the %OPENSHIFT_USERNAME%-observability-demo namespace.
-
Filter logs to show only error responses (404):
{kubernetes_namespace_name="%OPENSHIFT_USERNAME%-observability-demo"} |= "404" |jsonThe
|=operator filters for log lines containing "404". -
Query logs from a specific pod:
{kubernetes_namespace_name="%OPENSHIFT_USERNAME%-observability-demo", kubernetes_pod_name=~"frontend.*"} |jsonThe
=~operator matches a regular expression. -
Query frontend note activity generated from the UI:
{kubernetes_namespace_name="%OPENSHIFT_USERNAME%-observability-demo", kubernetes_pod_name=~"frontend.*"} |= "/api/notes" |json
This shows note creation and note update calls from the frontend route.
-
Combine multiple filters to find successful frontend requests:
{kubernetes_namespace_name="%OPENSHIFT_USERNAME%-observability-demo", kubernetes_pod_name=~"frontend.*"} |= "path=/ping" |= "status=200" |jsonThis shows successful
/pingrequests from the frontend pod. -
Use LogQL to count error rates:
sum(rate({kubernetes_namespace_name="%OPENSHIFT_USERNAME%-observability-demo"} |= "404" [5m]))This calculates the rate of 404 errors per second over the last 5 minutes.
-
Query logs from multiple applications:
{kubernetes_namespace_name="%OPENSHIFT_USERNAME%-observability-demo"} |json | line_format "{{.kubernetes_pod_name}}: {{.message}}"The
|jsonstage parses the collector’s JSON envelope, extracting labeled fields such asmessage,kubernetes_pod_name, andkubernetes_namespace_name.line_formatthen templates a new display line from those fields. -
Use
| unwrapto compute average response latency directly from log fields:LogQL unwrapping enables metric-style aggregations over numeric values embedded in log lines. The pipeline follows three stages:
-
Parse —
|json,| logfmt, or| regexpextracts named labels from the log line -
Unwrap —
| unwrap <field>promotes a label to a numeric sample value; optionally useduration()orbytes()for unit conversion -
Aggregate — range-vector functions
avg_over_time,sum_over_time,max_over_time,min_over_time,quantile_over_timeoperate on the unwrapped samples
This is valuable when a key signal (latency, error codes, payload size) lives only in log lines and has not yet been instrumented as a Prometheus metric.
avg_over_time( { kubernetes_namespace_name="%OPENSHIFT_USERNAME%-observability-demo", kubernetes_pod_name=~"frontend.*" } |json | regexp `duration_ms=(?P<duration_ms>\d+)` | unwrap duration_ms [5m] )|jsonparses the JSON envelope;| regexpextractsduration_msfrom themessagefield as a new label;| unwrap duration_mspromotes it to a numeric sample value;avg_over_timecomputes the average frontend response time in milliseconds over the last 5 minutes — without requiring a separate Prometheus metric. -
Verify
Check that you can query logs effectively:
-
✓ Logs from %OPENSHIFT_USERNAME%-observability-demo namespace are visible
-
✓ Filter queries return only matching log lines
-
✓ Pod-specific queries work with regex patterns
-
✓ Rate calculations show error frequency
-
✓ Logs from multiple applications can be queried together
-
✓
| unwrapcomputes numeric aggregations over values embedded in log lines
What you learned: LogQL uses labels (like namespace, pod name) to select log streams, then filters content with operators like |= (contains) and != (does not contain). Parsing stages (|json, | regexp) extract structured fields, and | unwrap unlocks metric-style aggregations over those fields.
Troubleshooting
Issue: No logs appear in query results
Solution:
. Wait 1-2 minutes for logs to be ingested by Loki
. Verify pods are running: oc get pods -n %OPENSHIFT_USERNAME%-observability-demo
. Check collector is forwarding logs: oc logs -n openshift-logging -l app.kubernetes.io/component=collector --tail=100
. Verify time range in query interface (expand to last 1 hour)
Issue: Query returns "Error: parse error"
Solution:
. Check LogQL syntax (labels in braces, filters with pipes)
. Ensure label names are correct: kubernetes_namespace_name not namespace
. Use quotes around label values: {kubernetes_namespace_name="%OPENSHIFT_USERNAME%-observability-demo"}
Issue: Rate queries return no data
Solution:
. Ensure enough matching logs exist (generate more traffic)
. Check time range: [5m] requires data in last 5 minutes
. Verify filter matches log content: |= "404" requires "404" in log lines
Exercise 4: Correlate logs with metrics
The real power of observability comes from correlating different signals. You’ll use metrics from Module 1 alongside logs to diagnose an issue faster.
Steps
-
Generate a burst of errors to simulate an incident:
oc run -n %OPENSHIFT_USERNAME%-observability-demo error-generator --rm -i --restart=Never --image=quay.io/curl/curl:8.11.1 -- \ sh -c 'for i in $(seq 1 100); do curl -s -o /dev/null http://frontend:8080/error; sleep 0.1; done' -
Check metrics to detect the traffic spike:
Navigate to Observe → Metrics
Query:
sum by (service) (rate(http_requests_total{code="404", namespace="%OPENSHIFT_USERNAME%-observability-demo}[5m]))You should see a traffic spike while the error generator is running.
-
Switch to Observe → Logs and correlate with log data:
{kubernetes_namespace_name="%OPENSHIFT_USERNAME%-observability-demo"} |= "404" |= "error" | jsonThis shows the actual error log messages during the spike.
-
Use time range alignment to see the correlation:
In the logs interface, set the time range to match when you saw the metric spike (last 15 minutes).
Compare the timestamp of log entries with the metric spike time.
-
Extract structured data from logs:
{kubernetes_namespace_name="%OPENSHIFT_USERNAME%-observability-demo"}
  |= "404"
  | regexp `(?P<timestamp>\d{4}/\d{2}/\d{2} \d{2}:\d{2}:\d{2}).*method=(?P<method>\w+).*status=(?P<status>\d{3})`
  | line_format "{{.timestamp}} - {{.method}} {{.status}}"
This extracts timestamp, HTTP method, and status code from log lines.
|
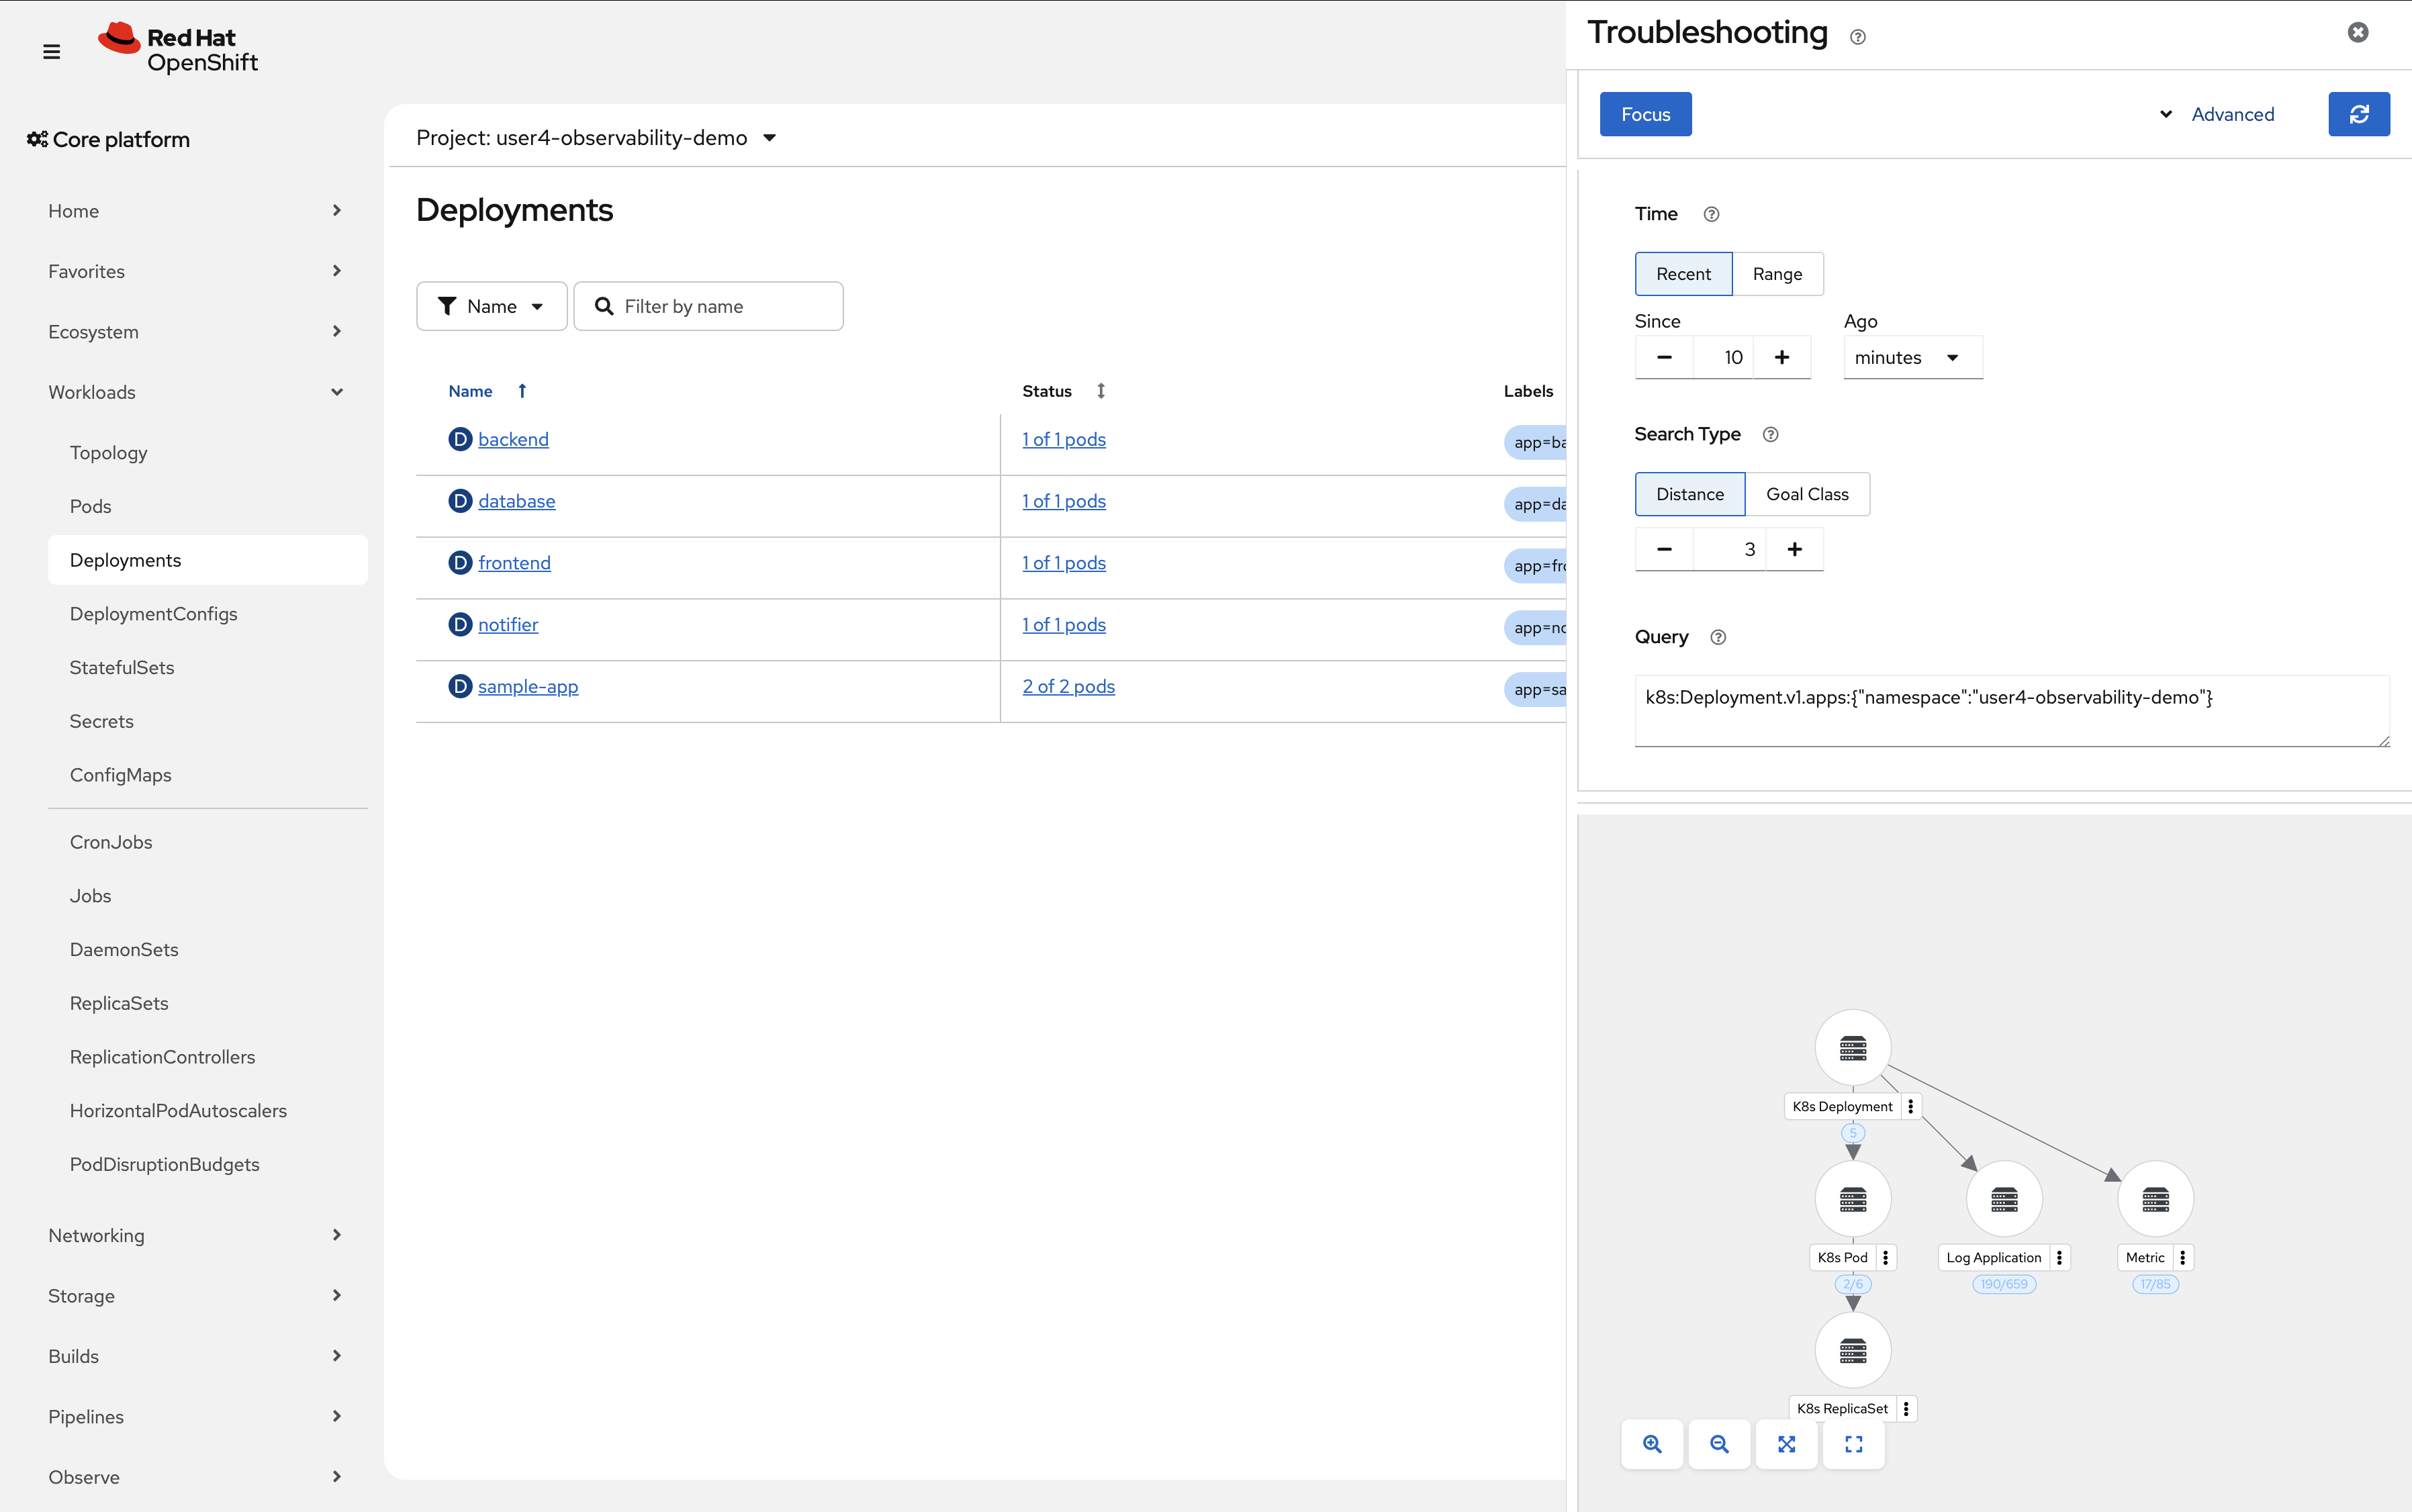
OpenShift also provides out-of-the-box correlation between metrics and logs in the console. |
Navigate to Workloads → Deployments → In the top right, click the "dotted kube" icon → "Signal Correlation"
Verify
Check that you can correlate metrics and logs:
-
✓ Metric query shows frontend traffic spike
-
✓ Log query reveals error messages during the same time period
-
✓ Time ranges align between metrics and logs views
-
✓ Structured data can be extracted from log lines
-
✓ Correlation reduces investigation time from minutes to seconds
What you learned: Metrics tell you when and where problems occur. Logs provide the detailed context explaining why. Together, they reduce mean time to resolution through unified analysis.
Troubleshooting
Issue: Metric and log timestamps don’t align
Solution: . Check timezone settings in console (both views should use same timezone) . Verify system clocks are synchronized across cluster nodes . Allow 30-60 seconds for metric scraping and log ingestion delays
Issue: Cannot extract structured data with regexp
Solution:
. Verify log format matches regex pattern
. View raw logs first: {kubernetes_namespace_name="%OPENSHIFT_USERNAME%-observability-demo"}
. Test regex pattern against actual log samples
. Use simpler filters first, then add complexity
Exercise 5: Log-based alerting
Just as Prometheus evaluates PromQL expressions to generate metric-based alerts, LokiStack includes a built-in ruler component that evaluates LogQL expressions on a schedule and fires alerts when thresholds are exceeded. Those alerts are then forwarded to Alertmanager, which handles routing, grouping, silencing, and notification — exactly the same pipeline used by metric alerts.
How it works
The Loki ruler evaluates AlertingRule resources (a CRD provided by the Loki Operator). When an expression matches, the ruler sends the alert to Alertmanager, which routes it according to its normal configuration (email, PagerDuty, Slack receivers, etc.).
For the application tenant, AlertingRule resources must be created in the application namespace and that namespace must carry the label openshift.io/loki-rules: "true". The workshop pre-provisions this label on your demo namespace.
A complete AlertingRule that fires when the 404 error rate exceeds 0.5 per second for 2 minutes looks like this:
apiVersion: loki.grafana.com/v1
kind: AlertingRule
metadata:
  name: high-error-rate
  namespace: %OPENSHIFT_USERNAME%-observability-demo
  labels:
    openshift.io/loki-rules: "true"
spec:
  tenantID: application
  groups:
  - name: application-errors
    interval: 30s
    rules:
    - alert: HighApplicationErrorRate
      expr: |
        sum(rate({kubernetes_namespace_name="%OPENSHIFT_USERNAME%-observability-demo"} |= "404" [5m])) > 0.5
      for: 2m
      labels:
        severity: warning
        team: platform
      annotations:
        summary: "High error rate in %OPENSHIFT_USERNAME%-observability-demo"
        description: "More than 0.5 errors/second for 2 minutes in namespace %OPENSHIFT_USERNAME%-observability-demo."
The key fields map directly to Prometheus alerting semantics:
| Field | Meaning |
|---|---|
|
LogQL expression evaluated by the Loki ruler. A non-zero result means the alert is active. |
|
The expression must stay true for this duration before the alert transitions from Pending to Firing. |
|
Key/value pairs attached to the alert — used by Alertmanager for routing and silencing. |
|
Human-readable |
Alert lifecycle
Once created, the alert follows the same lifecycle as any Prometheus alert:
-
Inactive — LogQL expression evaluates to zero (no 404s above threshold)
-
Pending — Expression is true but
forduration has not elapsed yet -
Firing — Expression has been true for longer than
for; Alertmanager receives the alert and routes it
Navigate to Observe → Alerting → Alerting rules in the OpenShift console to see log-based alerts alongside metric-based ones.
What you learned: LokiStack’s ruler component evaluates LogQL expressions and fires alerts through the same Alertmanager pipeline used by Prometheus. This means log patterns — error bursts, missing heartbeats, security events — can trigger the same notifications and on-call workflows as metric alerts, with no additional tooling required.
Learning outcomes
By completing this module, you should now understand:
-
✓ LokiStack’s label-based indexing approach reduces storage costs compared to full-text indexing
-
✓ ClusterLogForwarder routes application logs from pods to Loki for centralized storage
-
✓ LogQL queries use labels to select streams and filters to search log content
-
✓ Correlating logs with metrics reduces troubleshooting time through unified analysis
-
✓ LokiStack’s ruler evaluates LogQL expressions and forwards alerts to Alertmanager, using the same routing and notification pipeline as metric-based alerts
Business impact:
You’ve eliminated the manual log searching process. Instead of accessing individual pods and searching files manually, you now have:
-
Centralized logs from all 12+ microservices in 1 queryable system
-
Ability to search across all services simultaneously with LogQL
-
Correlation between metric spikes and log messages
-
Automated alerts on critical log patterns
Estimated time savings: Reduced log investigation time from 30-60 minutes to 2-5 minutes per incident.
Next steps: Module 3 will add distributed tracing, enabling you to follow individual requests across all microservices to identify performance bottlenecks.
Module summary
You successfully implemented centralized logging with LokiStack.
What you accomplished:
-
Verified the LokiStack logging infrastructure deployed via GitOps
-
Generated diverse application logs across multiple services
-
Wrote LogQL queries to filter and search logs across distributed applications
-
Correlated metric spikes with detailed log messages for faster root cause analysis
-
Learned how LokiStack’s ruler and Alertmanager work together for log-based alerting
Key concepts mastered:
-
LokiStack: Label-based log aggregation system optimized for Kubernetes
-
ClusterLogForwarder: Routes logs from pods to configured outputs (Loki)
-
LogQL: Query language for searching and filtering log streams
-
Log correlation: Combining logs with metrics for comprehensive troubleshooting
-
Log-based alerting:
AlertingRuleCRs evaluated by the Loki ruler feed alerts into Alertmanager for routing, silencing, and notification
LogQL operators learned:
-
{label="value"}: Select log streams by label -
|=: Filter for lines containing text -
!=: Exclude lines containing text -
|~: Regex match filter -
rate(): Calculate rate of log entries -
regexp: Extract structured data from logs -
| unwrap <field>: Promote a parsed label to a numeric sample for metric aggregations -
avg_over_time / sum_over_time / max_over_time: Aggregate unwrapped numeric values over a time window
Continue to Module 3 to add distributed tracing capabilities.