Module 1: User workload monitoring
Your organization needs to improve visibility into microservices application health and performance. The current infrastructure monitoring does not provide insight into application-level metrics or business-critical functionality.
You will implement user workload monitoring to track application performance, latency, and error rates. Custom metrics and alerts will enable proactive detection of application issues before they impact users.
In this module, you’ll learn how to configure Prometheus monitoring for custom application metrics and create alerts that notify you when applications deviate from expected behavior.
- Learning objectives
- Understanding observability foundations
- Exercise 1: Explore the monitoring stack
- Exercise 2: Deploy a sample application with metrics
- Exercise 3: Configure ServiceMonitor to collect metrics
- Exercise 4: Create custom dashboards with COO
- Exercise 5: Configure alerting rules
- Learning outcomes
- Module summary
Learning objectives
By the end of this module, you’ll be able to:
-
Understand the 3 pillars of observability (metrics, logs, traces) and when to use each
-
Configure ServiceMonitor resources to collect custom application metrics
-
Write PromQL queries to analyze application performance
-
Create declarative Perses dashboards for application visibility in the OpenShift console
-
Configure Alertmanager rules to proactively notify you of application issues
Understanding observability foundations
Before implementing monitoring, you need to understand the observability landscape.
The 3 pillars of observability
Use all 3 signal types together:
-
Metrics: Numeric trends over time (request rate, latency percentiles, CPU)
-
Best for: Detection, thresholds, alerting
-
-
Logs: Timestamped events with context (errors, transaction IDs, user actions)
-
Best for: Root cause details and audit trails
-
-
Traces: End-to-end request flow across services
-
Best for: Finding latency bottlenecks and dependency issues
-
Practical workflow:
-
Start with metrics to detect a problem
-
Use logs to identify what failed
-
Use traces to locate where it failed
Observability methodologies
Use these common methods to decide which metrics matter most:
-
RED (services): Rate, Errors, Duration
-
USE (infrastructure): Utilization, Saturation, Errors
-
Golden Signals: Latency, Traffic, Errors, Saturation
In this workshop, you’ll primarily use the RED method for monitoring the sample application’s HTTP requests (rate, errors, duration). The Prometheus metrics http_requests_total and http_request_duration_seconds directly support this methodology.
|
OpenShift monitoring architecture
OpenShift provides 3 complementary monitoring options:
-
Platform monitoring (CMO)
-
Namespace:
openshift-monitoring -
Purpose: Cluster and control-plane health
-
Managed by: Cluster admins
-
-
User workload monitoring (CMO)
-
Namespace:
openshift-user-workload-monitoring -
Purpose: Cluster-wide application monitoring using ServiceMonitor
-
Trade-off: Easy to use, limited customization
-
-
Cluster Observability Operator (COO)
-
Purpose: Independent, namespace-scoped monitoring stacks via
MonitoringStack -
Discovery: Label-based selectors (for example,
monitoring.rhobs/stack: observability-stack) -
Components: Prometheus plus optional Thanos Querier, Alertmanager, and UI plugins (including Perses dashboards)
-
Best for: Multi-tenant teams, custom dashboards, and flexible retention/configuration
-
CMO and COO can run together without conflict.
In this workshop, you’ll use both user workload monitoring (Exercises 1-3) and COO (Exercise 4 onward) to understand the full range of monitoring options available in OpenShift.
Exercise 1: Explore the monitoring stack
You need to verify that user workload monitoring is enabled and understand the components deployed in your cluster.
The observability stack was pre-configured via GitOps, so Prometheus and Alertmanager should already be running.
Steps
-
Log into the OpenShift console at OpenShift Console
Use the credentials provided in your lab interface:
-
Username: %OPENSHIFT_USERNAME%
-
-
Verify user workload monitoring pods are running:
oc get pods -n openshift-user-workload-monitoringExpected outputNAME READY STATUS RESTARTS AGE prometheus-operator-xxxxx 2/2 Running 0 1h prometheus-user-workload-0 6/6 Running 0 1h prometheus-user-workload-1 6/6 Running 0 1h thanos-ruler-user-workload-0 3/3 Running 0 1h thanos-ruler-user-workload-1 3/3 Running 0 1h -
In the OpenShift console, navigate to the project openshift-user-workload-monitoring → Workloads and verify user workload monitoring is enabled:
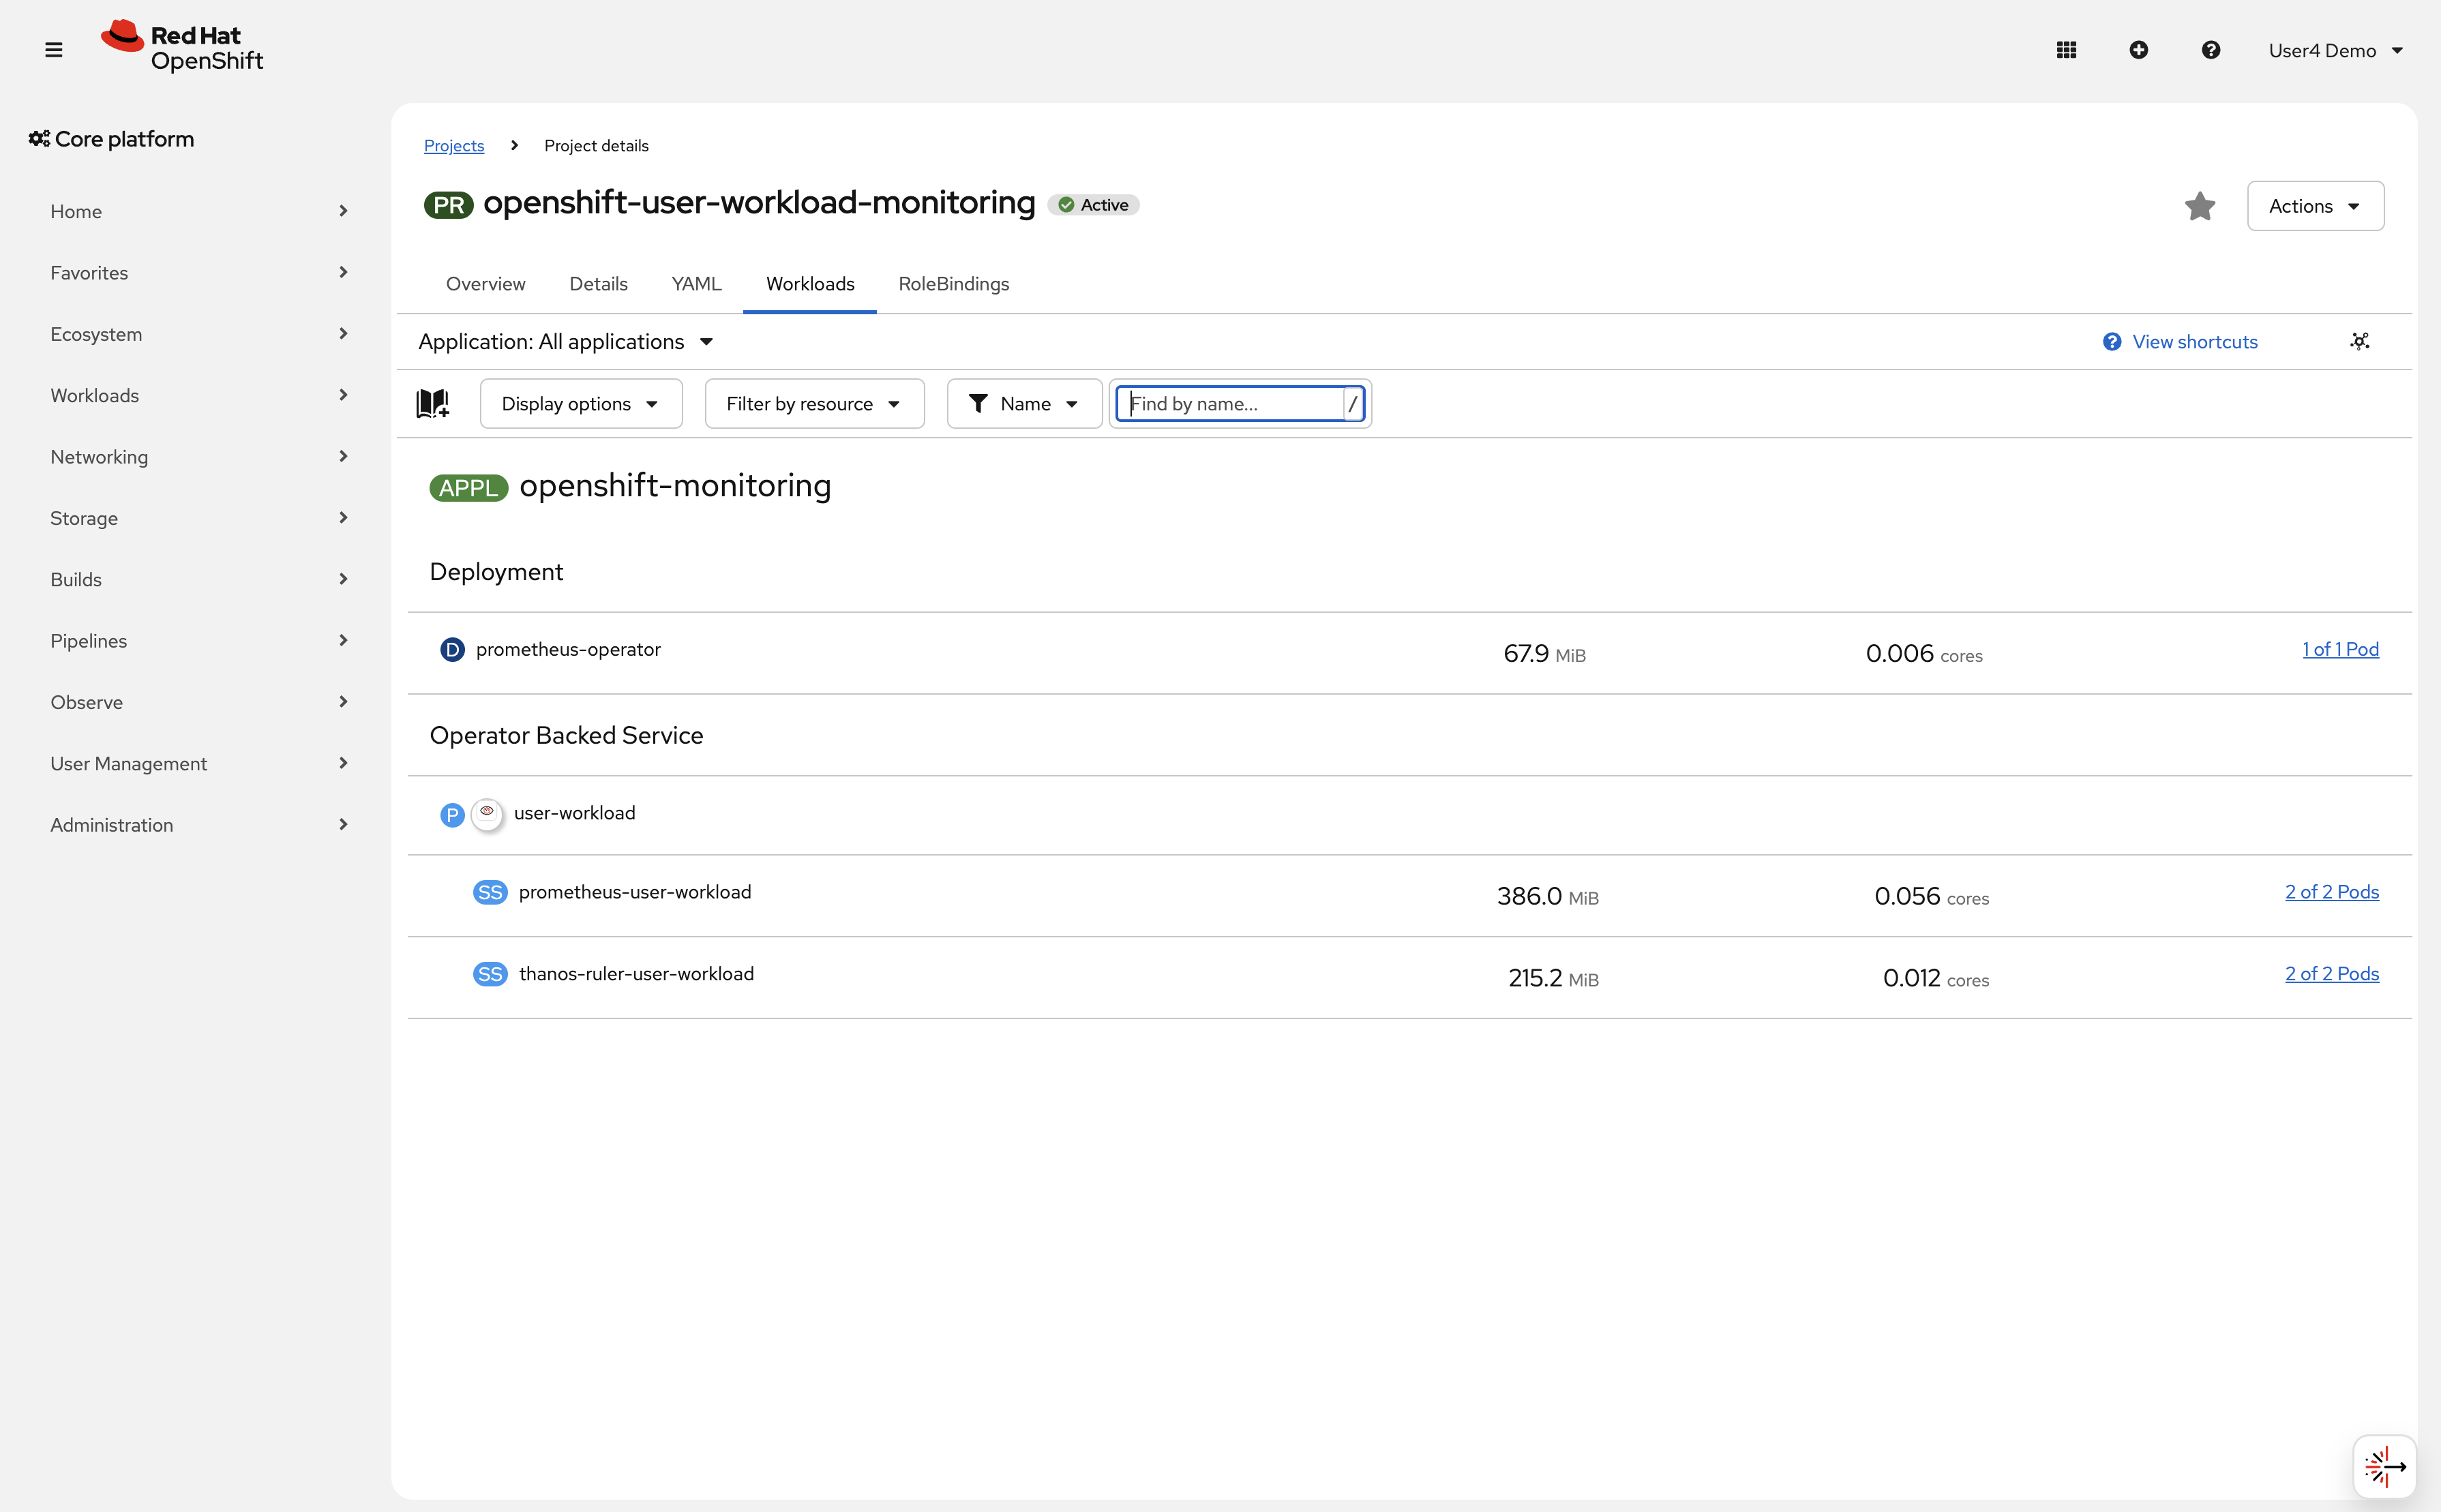
-
Access the OpenShift console monitoring interface:
-
Navigate to Observe → Metrics in the left navigation
-
This opens the Prometheus query interface, make sure the namespace filter is set to
openshift-user-workload-monitoring.
-
-
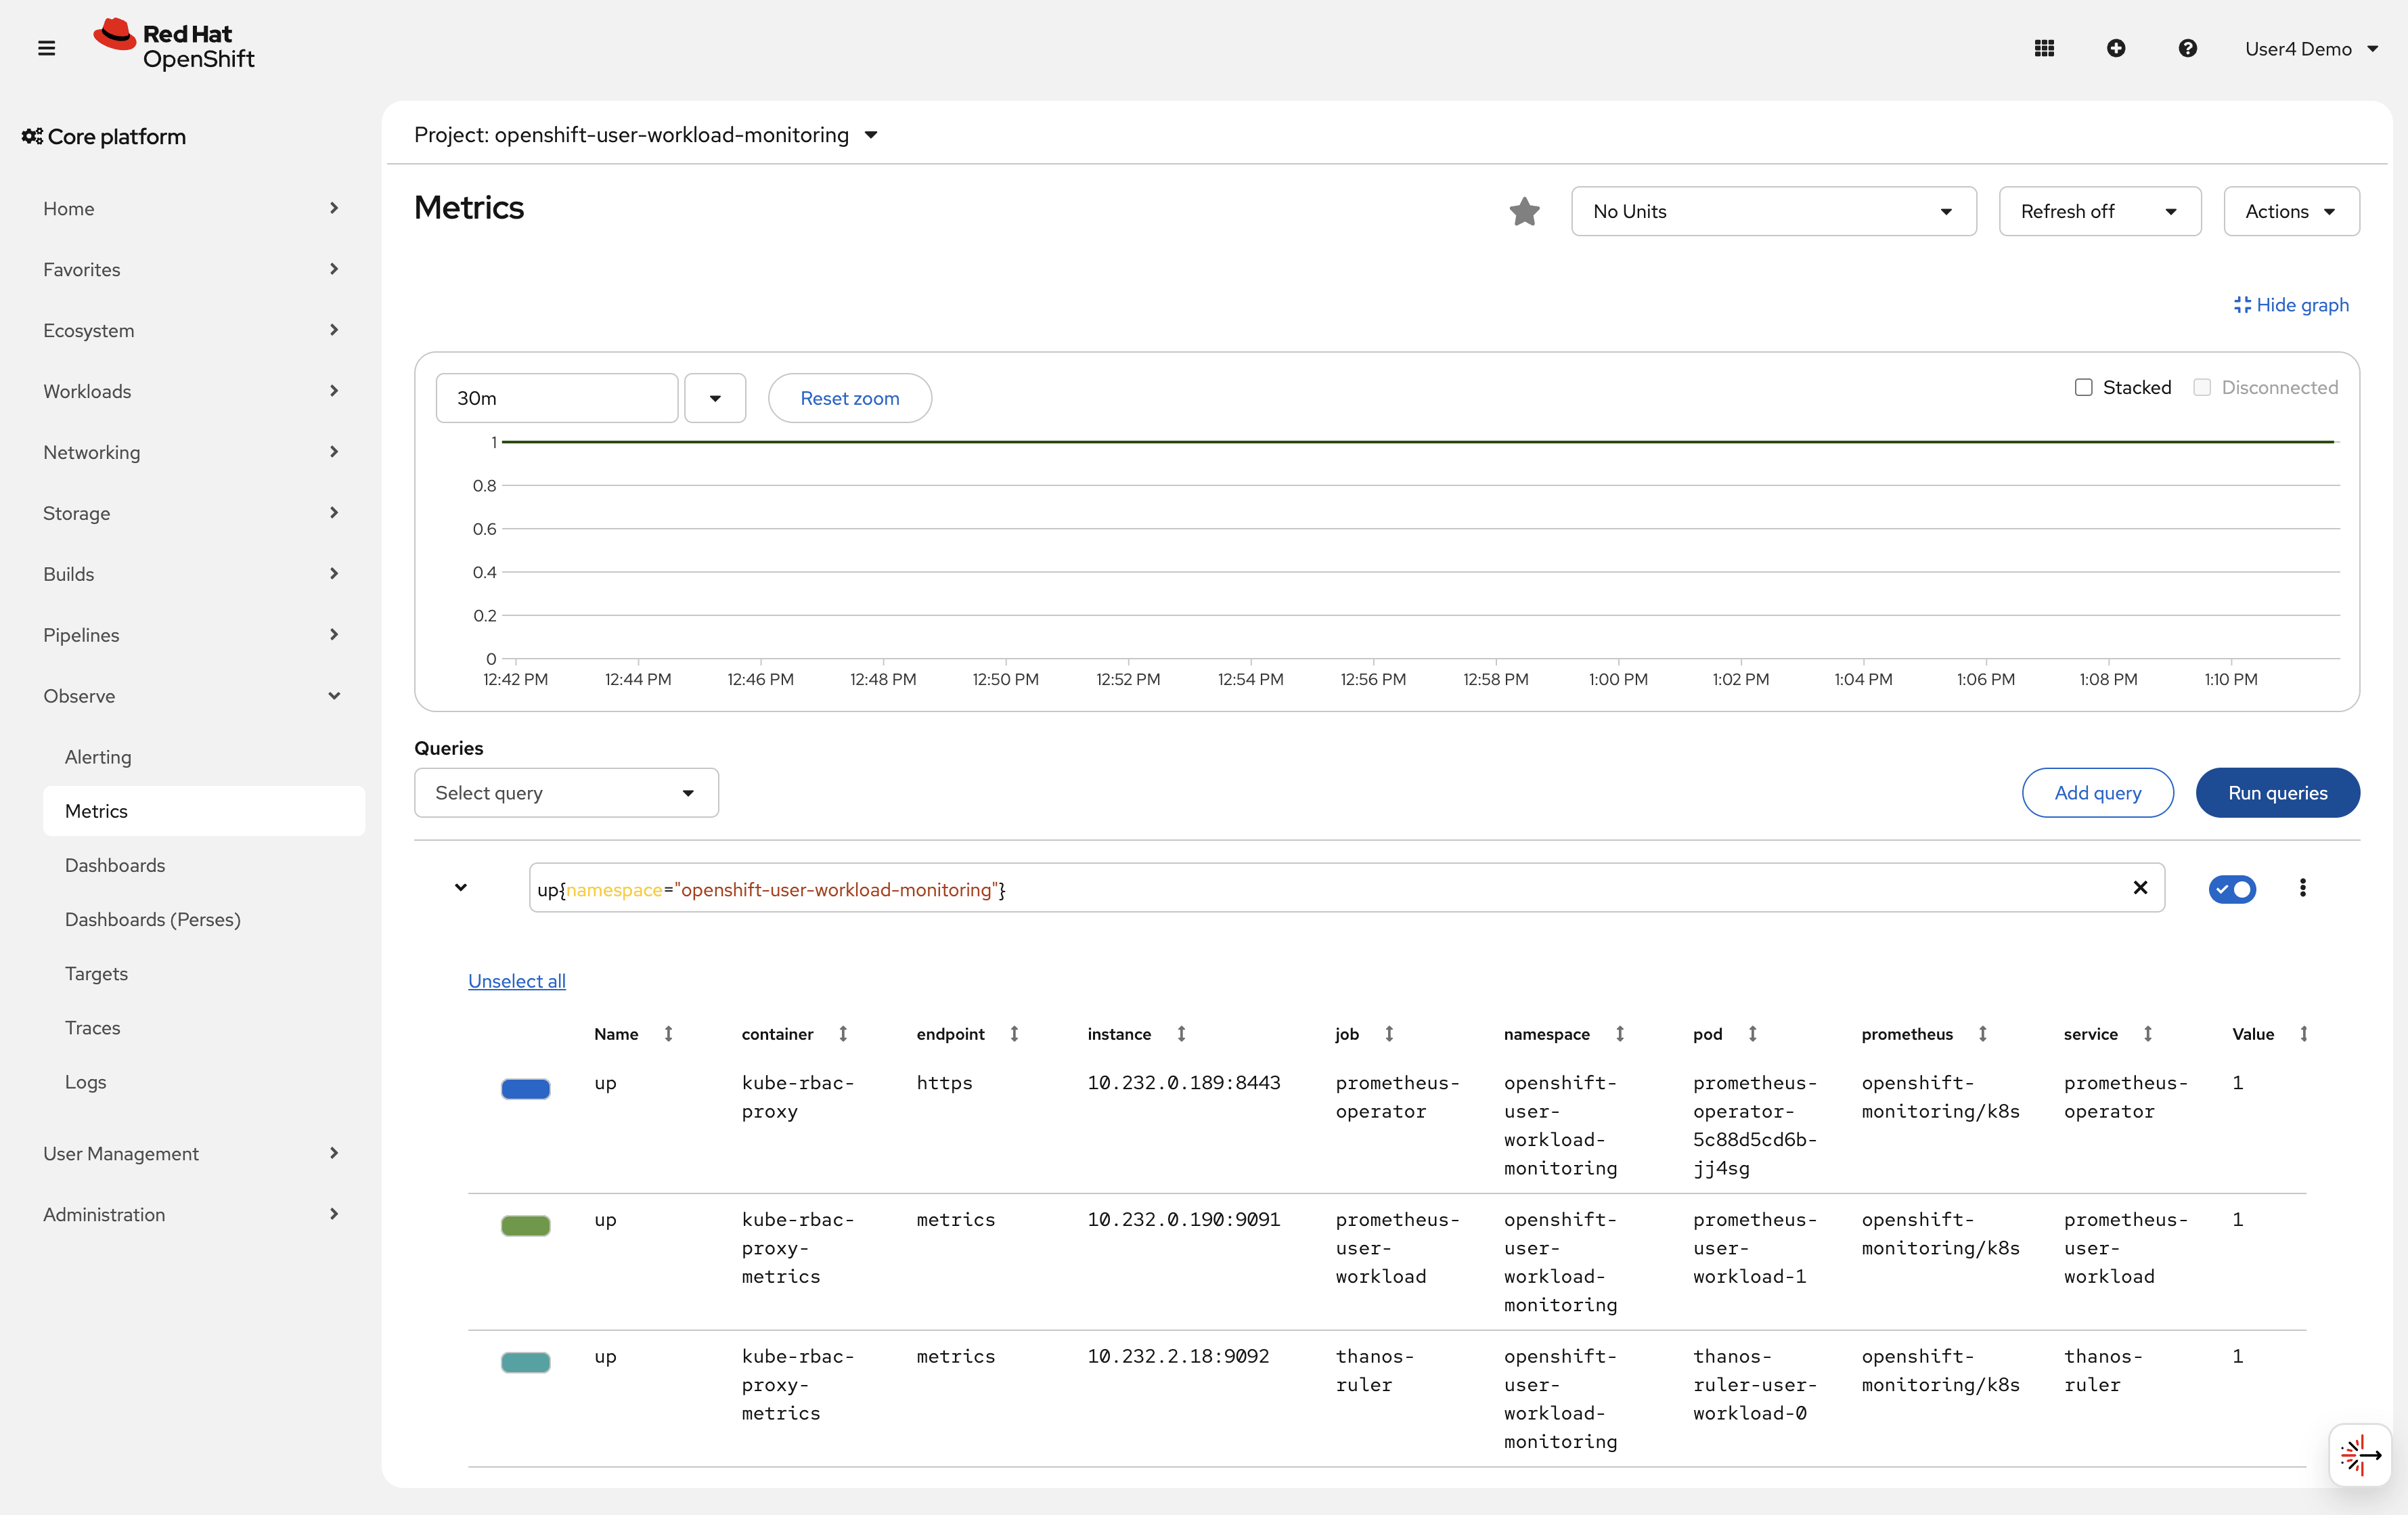
Run your first PromQL query to see cluster metrics:
In the query box, enter:
up{namespace="openshift-user-workload-monitoring"}Click Run Queries
This shows all targets being scraped in the user workload monitoring namespace. Each target should show
value: 1(up and healthy).
Verify
Check that your monitoring stack is operational:
-
✓ All pods in
openshift-user-workload-monitoringare Running -
✓ User workload monitoring is enabled (
enableUserWorkload: true) -
✓ Prometheus query interface is accessible
-
✓ PromQL query returns results
What you learned: OpenShift includes CMO-managed platform and user workload monitoring, plus optional COO stacks for advanced use cases. In this exercise, you verified the CMO user workload stack.
Exercise 2: Deploy a sample application with metrics
To practice monitoring, you need an application that exposes metrics. You’ll deploy a sample application that provides Prometheus-compatible metrics.
| Your workshop namespace has been pre-created with special permissions to create ServiceMonitor and PrometheusRule resources. These permissions are required for this workshop and are granted via a custom ClusterRole. |
Steps
-
Create a new project for your sample application:
oc new-project %OPENSHIFT_USERNAME%-observability-demoIf the namespace already exists, you can switch to it with oc project %OPENSHIFT_USERNAME%-observability-demo. The namespace has been pre-configured with the necessary monitoring permissions. -
Deploy a sample application that exposes metrics:
cat <<EOF | oc apply -f -
apiVersion: apps/v1
kind: Deployment
metadata:
  name: sample-app
  namespace: %OPENSHIFT_USERNAME%-observability-demo
  labels:
    app: sample-app
spec:
  replicas: 2
  selector:
    matchLabels:
      app: sample-app
  template:
    metadata:
      labels:
        app: sample-app
    spec:
      containers:
      - name: app
        image: quay.io/brancz/prometheus-example-app:v0.3.0
        ports:
        - containerPort: 8080
          name: http
      - name: debug
        image: registry.access.redhat.com/ubi9/ubi-minimal:latest
        command: ["/bin/sh", "-c", "while true; do sleep 30; done"]
        resources:
          requests:
            memory: "32Mi"
            cpu: "50m"
          limits:
            memory: "64Mi"
            cpu: "100m"
---
apiVersion: v1
kind: Service
metadata:
  name: sample-app
  namespace: %OPENSHIFT_USERNAME%-observability-demo
  labels:
    app: sample-app
spec:
  selector:
    app: sample-app
  ports:
  - port: 8080
    targetPort: 8080
    name: http
EOF
This creates a deployment with 2 replicas and a service to expose the application.
The deployment includes a debug sidecar container with UBI minimal. This sidecar provides debugging tools like curlwithout bloating the main application container. This is a common pattern for production debugging. -
Verify the pods are running:
oc get pods -n %OPENSHIFT_USERNAME%-observability-demoExpected outputNAME READY STATUS RESTARTS AGE sample-app-xxxxx-xxxxx 2/2 Running 0 30s sample-app-xxxxx-xxxxx 2/2 Running 0 30sNote the
2/2ready status indicates both the application and debug sidecar containers are running. -
Check what metrics the application exposes using the debug sidecar:
First, make a request to the application to initialize the metrics:
oc exec -n %OPENSHIFT_USERNAME%-observability-demo deployment/sample-app -c debug -- curl -s localhost:8080Expected outputHello from example application.Now check the metrics endpoint:
oc exec -n %OPENSHIFT_USERNAME%-observability-demo deployment/sample-app -c debug -- curl -s localhost:8080/metrics | head -20The
-c debugflag specifies which container to exec into (the debug sidecar). Since containers in the same pod share the network namespace, the sidecar can accesslocalhost:8080.Sample output# HELP http_request_duration_seconds Duration of all HTTP requests # TYPE http_request_duration_seconds histogram http_request_duration_seconds_bucket{code="200",handler="found",method="get",le="0.005"} 1 http_request_duration_seconds_bucket{code="200",handler="found",method="get",le="0.01"} 1 ... # HELP http_requests_total Count of all HTTP requests # TYPE http_requests_total counter http_requests_total{code="200",method="get"} 1 # HELP version Version information about this binary # TYPE version gauge version{version="v0.3.0"} 1The application exposes several metrics:
-
http_requests_total: Counter of all HTTP requests by status code and method -
http_request_duration_seconds: Histogram of request latency -
version: Application version informationMetrics are lazy-initialized and only appear after the first request. This is why we made an initial request before checking the metrics endpoint.
-
Exercise 3: Configure ServiceMonitor to collect metrics
Now you’ll configure Prometheus to scrape metrics from your sample application using a ServiceMonitor resource.
A ServiceMonitor tells Prometheus which services to scrape for metrics. It uses label selectors to find services and defines scrape intervals and ports.
Steps
-
Create a ServiceMonitor resource:
cat <<EOF | oc apply -f -
apiVersion: monitoring.coreos.com/v1
kind: ServiceMonitor
metadata:
  name: sample-app-monitor
  namespace: %OPENSHIFT_USERNAME%-observability-demo
  labels:
    app: sample-app
spec:
  selector:
    matchLabels:
      app: sample-app
  endpoints:
  - port: http
    interval: 30s
    path: /metrics
EOF
This ServiceMonitor tells Prometheus to:
-
Find services with label
app: sample-app -
Scrape the
httpport -
Collect metrics every 30 seconds
-
Use the
/metricspath
-
-
Verify the ServiceMonitor was created:
oc get servicemonitor -n %OPENSHIFT_USERNAME%-observability-demoExpected outputNAME AGE sample-app-monitor 10s -
Generate some traffic to create metrics:
oc exec -n %OPENSHIFT_USERNAME%-observability-demo deployment/sample-app -c debug -- sh -c \
  'for i in $(seq 1 60); do
     r=$(od -An -N1 -tu1 /dev/urandom | tr -d " ");
     case $(( r % 10 )) in
       7|8) ep="/err" ;;
       9)   ep="/internal-err" ;;
       *)   ep="/" ;;
     esac;
     curl -s localhost:8080$ep > /dev/null;
     sleep $(awk "BEGIN{srand(); printf \"%.2f\\n\", rand() * 0.4}");
   done'
This sends 60 HTTP requests using the debug sidecar: ~70% to
/(200 OK), ~20% to/err(404), and ~10% to/internal-err(500). The mix populateshttp_requests_totalwith multiplecodelabel values, producing visible error rates alongside the success rate in Prometheus. -
Wait 1-2 minutes for Prometheus to scrape the metrics, then query them:
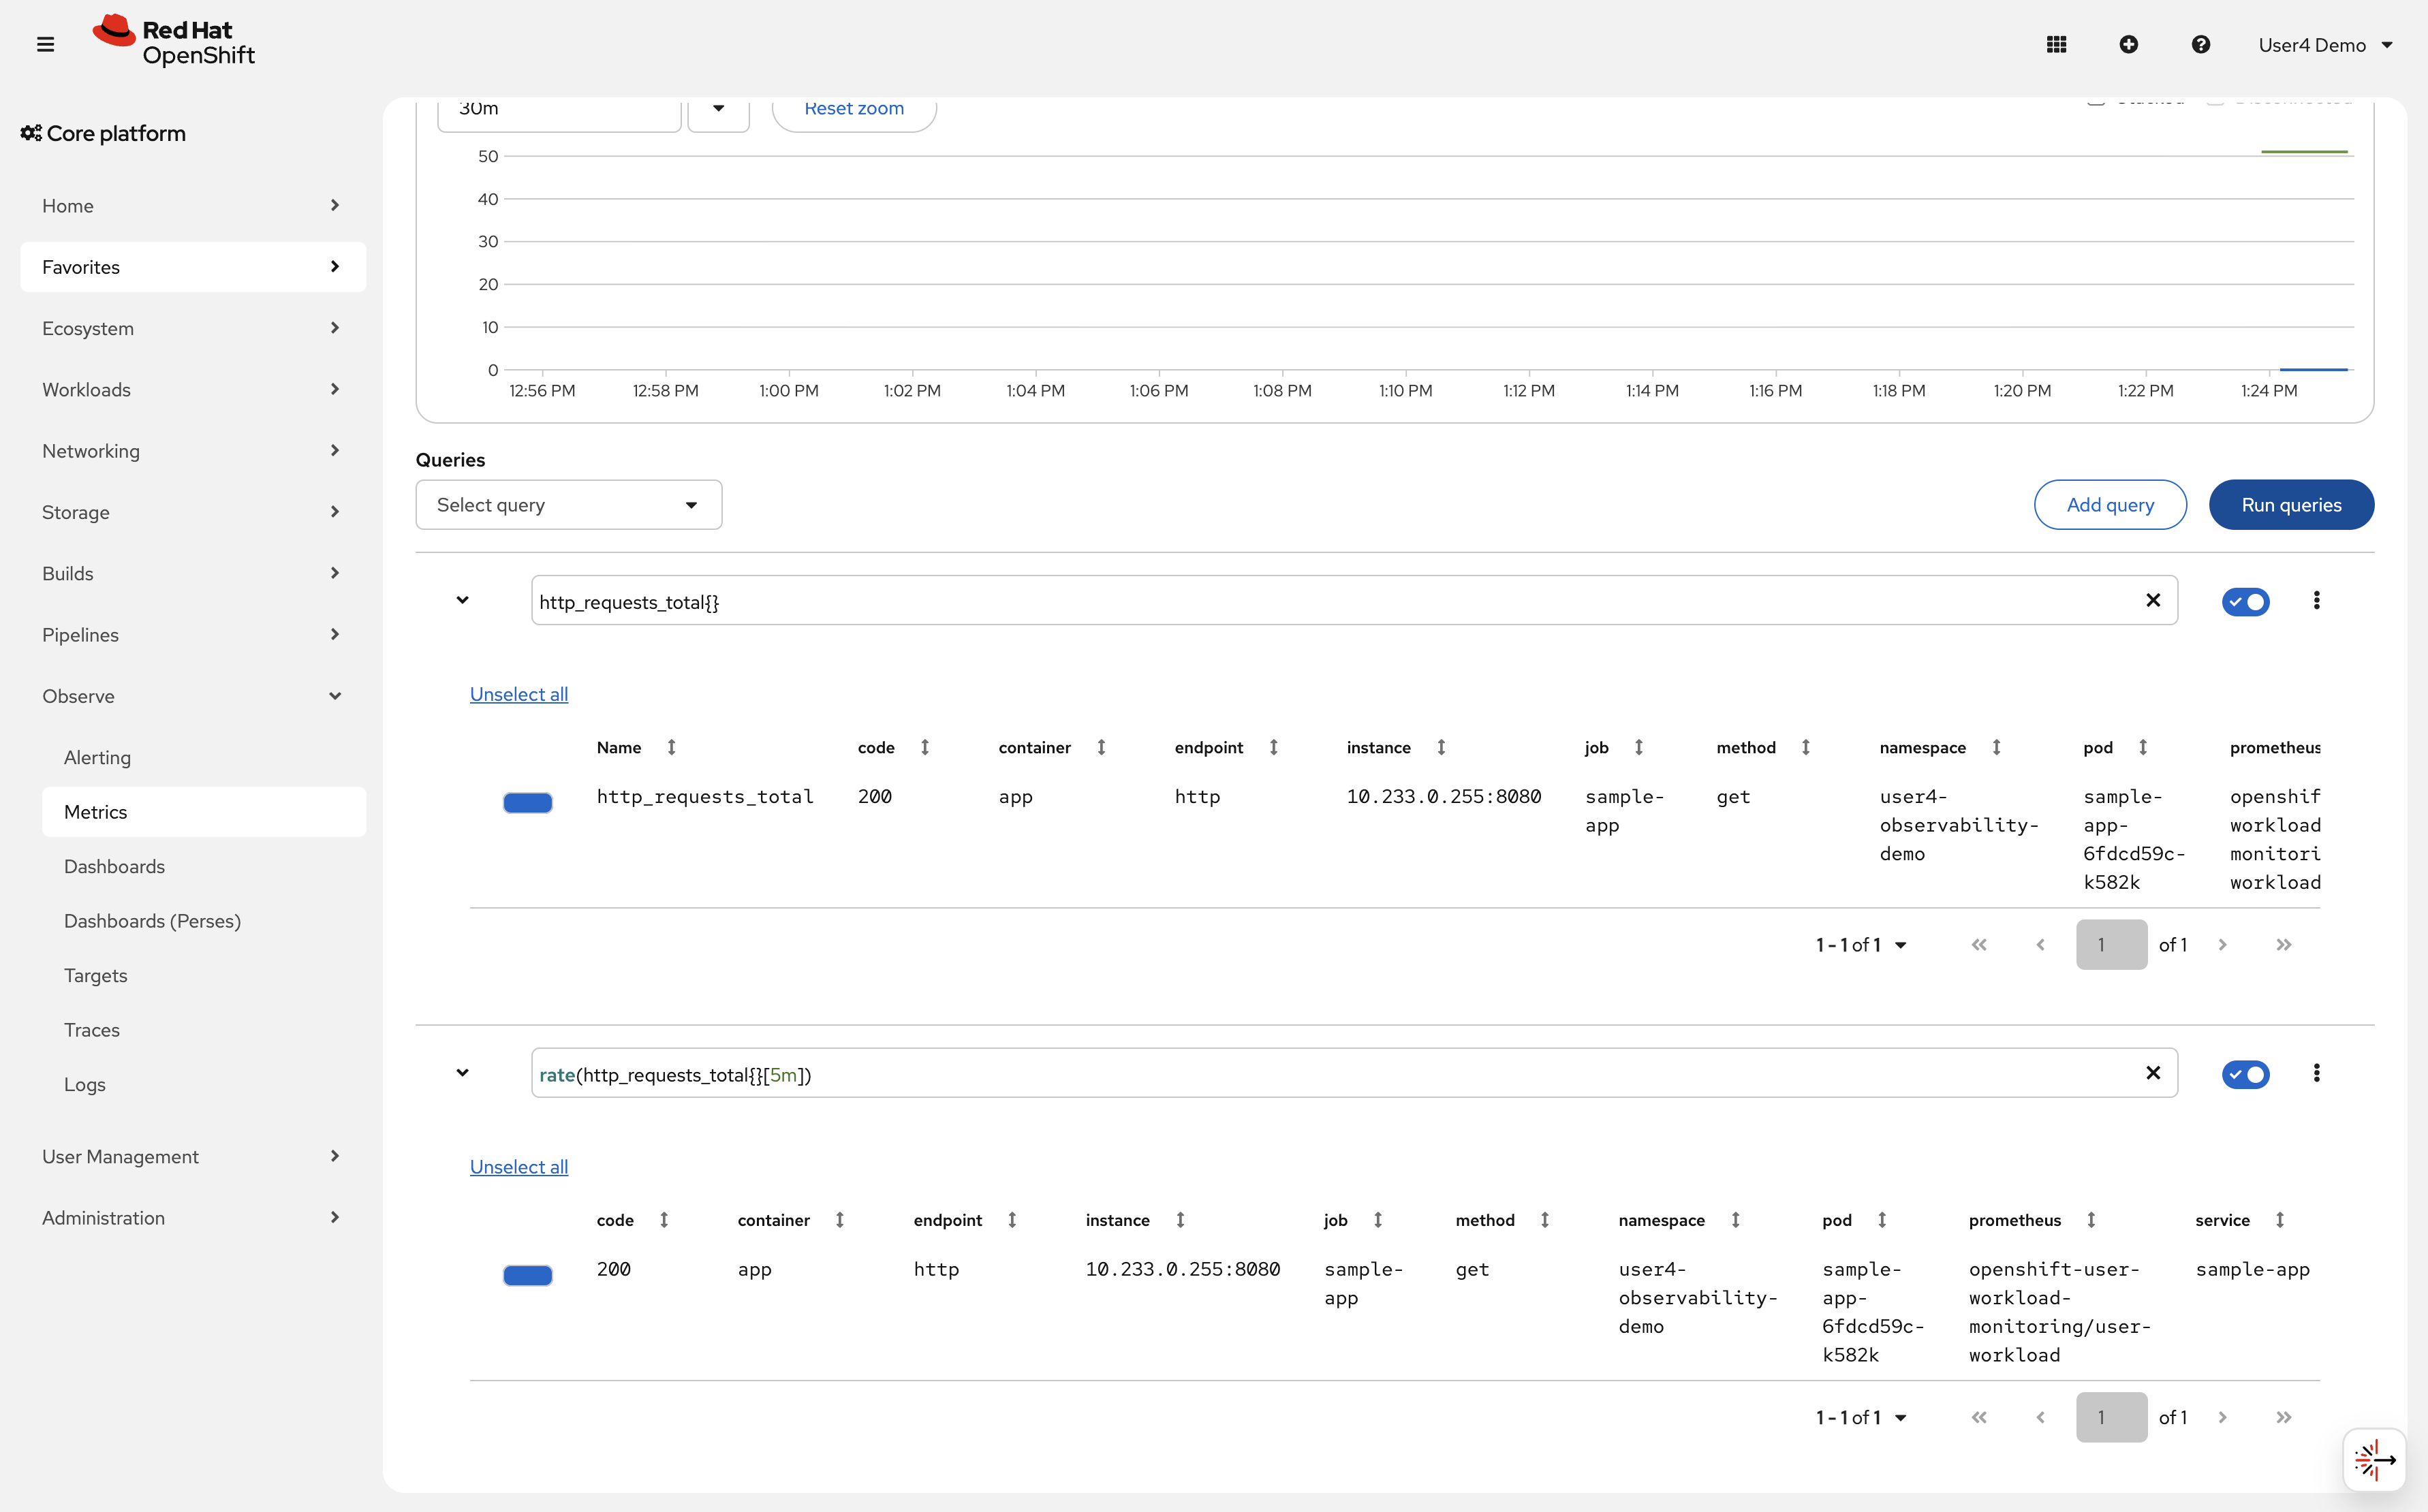
Go to Observe → Metrics in the OpenShift console.
Enter this PromQL query:
http_requests_total{}Click Run Queries
You should see results showing the counter values for each pod.
-
Query the rate of requests over time, you can add a new query:
rate(http_requests_total{}[5m])This shows requests per second averaged over 5 minutes.
Verify
Check that Prometheus is collecting your application metrics:
-
✓ ServiceMonitor exists in %OPENSHIFT_USERNAME%-observability-demo namespace
-
✓ PromQL query
http_requests_totalreturns data -
✓ Multiple time series (1 per pod) are visible
-
✓ Rate query shows request rate calculation
What you learned: ServiceMonitor resources configure Prometheus to scrape application metrics. Once configured, metrics are automatically collected and queryable via PromQL.
Troubleshooting
Issue: PromQL query returns no data
Solution:
. Wait 1-2 minutes for Prometheus to scrape metrics
. Verify ServiceMonitor exists: oc get servicemonitor -n %OPENSHIFT_USERNAME%-observability-demo
. Check that service labels match ServiceMonitor selector
. Verify pods are running and exposing metrics: oc exec -n %OPENSHIFT_USERNAME%-observability-demo deployment/sample-app -c debug — curl localhost:8080/metrics
Issue: Metrics show 0 requests
Solution: Generate traffic (run the curl loop again) and wait for Prometheus to scrape the updated values.
Exercise 4: Create custom dashboards with COO
Querying metrics via PromQL is effective, but visualizing trends over time provides better insights. You’ll use the Cluster Observability Operator (COO) to create custom dashboards.
Understanding COO vs user workload monitoring
Your cluster has 2 independent monitoring systems:
User Workload Monitoring (CMO) (Exercise 1-3):
-
Managed by Cluster Monitoring Operator (CMO)
-
Cluster-wide monitoring for all namespaces
-
Namespace:
openshift-user-workload-monitoring -
Automatically discovers ServiceMonitors in any namespace
-
Best for: Standard application monitoring with built-in OpenShift integration
-
Limited customization options
-
You’ve already used this for your sample-app
Cluster Observability Operator (COO) (Exercise 4):
-
Independent operator that functions alongside CMO (no conflicts)
-
Creates namespace-scoped monitoring stacks via MonitoringStack CR
-
Namespace:
observability-demo(can deploy to any namespace) -
Label-based ServiceMonitor discovery via
resourceSelector -
Best for: Multi-tenant environments, custom dashboards, longer retention, team-scoped metrics
-
Highly customizable (retention periods, storage, collection methods)
-
Optional components: Thanos Querier, Alertmanager, UI plugins (Perses dashboards)
Key difference: COO uses a label selector (resourceSelector.matchLabels) to discover ServiceMonitors. Your sample-app ServiceMonitor from Exercise 3 doesn’t have this label, so it’s only visible to user workload monitoring (CMO), not COO.
Why use both?:
-
CMO provides out-of-the-box monitoring for all applications
-
COO provides advanced features: multi-tenancy, custom dashboards, longer retention
-
They coexist independently - no conflicts
In this exercise, you’ll create a second ServiceMonitor with the COO-specific label to demonstrate multi-tenant monitoring and custom Perses dashboards.
Steps
-
Verify the COO MonitoringStack is deployed:
oc get monitoringstack -n observability-demoExpected outputNAME AGE observability-stack 1h -
Check the label selector the MonitoringStack uses to discover ServiceMonitors:
oc get monitoringstack observability-stack -n observability-demo -o jsonpath='{.spec.resourceSelector.matchLabels}'Expected output{"monitoring.rhobs/stack":"observability-stack"}ServiceMonitors must have this label to be discovered by the COO stack.
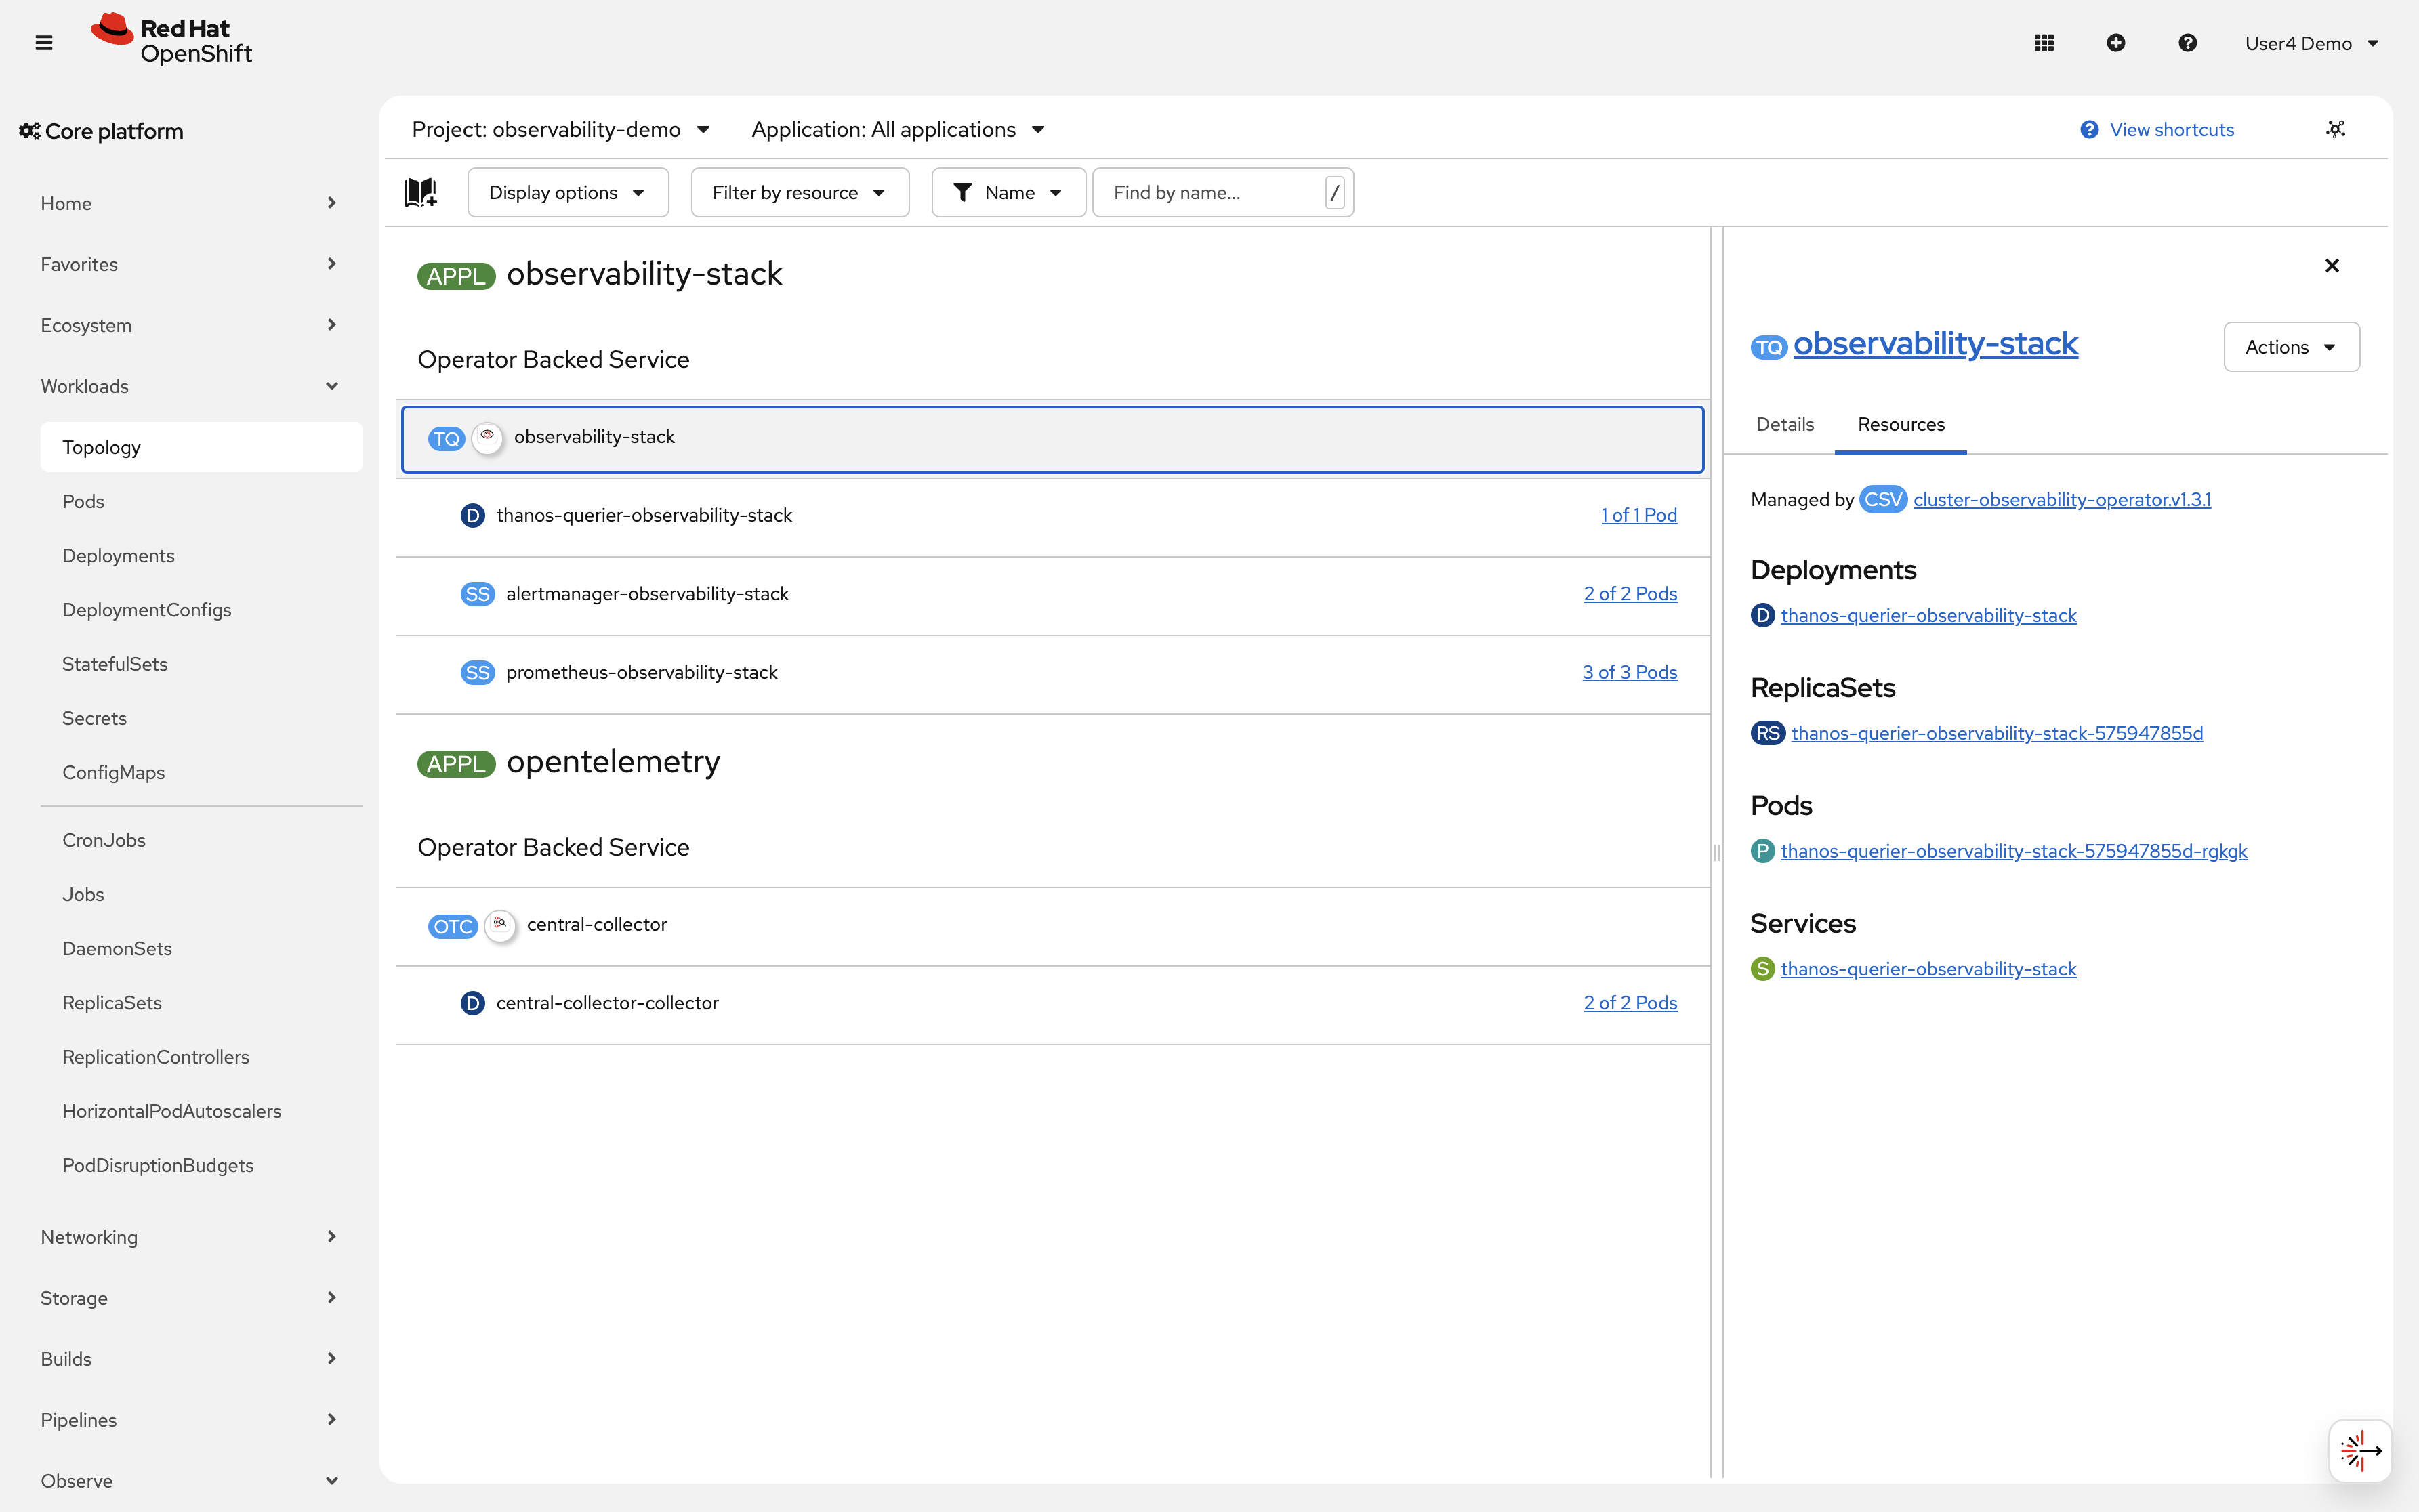
You can also see the COO stack in the console: click on Topology in the left navigation and select the observability-demo namespace. You should see the observability-stack operator-backed service managed by cluster-observability-operator, consisting of Prometheus (3 pods), Thanos Querier (1 pod), and Alertmanager (2 pods). You may also notice the opentelemetry application containing the central-collector deployment — this is the OpenTelemetry Collector configured in a later module.
-
Create a new ServiceMonitor with the COO label, for the COO we need to use the monitoring.rhobs/v1 API group instead of the monitoring.coreos.com group used by CMO. This is because COO uses a different Prometheus operator under the hood that watches for ServiceMonitors with the
monitoring.rhobs/stack: observability-stacklabel.cat <<EOF | oc apply -f - apiVersion: monitoring.rhobs/v1 kind: ServiceMonitor.monitoring.rhobs metadata: name: sample-app-coo namespace: %OPENSHIFT_USERNAME%-observability-demo labels: app: sample-app monitoring.rhobs/stack: observability-stack spec: selector: matchLabels: app: sample-app endpoints: - port: http interval: 30s path: /metrics EOFNote the
monitoring.rhobs/stack: observability-stacklabel - this tells COO to scrape this service. We keep the original ServiceMonitor from Exercise 3 to show how CMO and COO can run independently with different discovery methods (label-based for COO vs namespace-based for CMO). -
Verify the COO Prometheus stack has picked up your ServiceMonitor:
First, check that Prometheus pods are running:
oc get pods -n observability-demo -l app.kubernetes.io/name=prometheusExpected outputNAME READY STATUS RESTARTS AGE prometheus-observability-stack-0 2/2 Running 0 1h prometheus-observability-stack-1 2/2 Running 0 1h prometheus-observability-stack-2 2/2 Running 0 1hWait 1-2 minutes for Prometheus to discover the new ServiceMonitor, then verify it’s being scraped:
oc exec -n observability-demo prometheus-observability-stack-0 -c prometheus -- \
  curl -s http://localhost:9090/api/v1/targets | \
  grep -E 'sample-app.*%OPENSHIFT_USERNAME%-observability-demo' | head -5
Expected output (showing your application is being monitored)..."job":"sample-app-coo/sample-app/0","namespace":"%OPENSHIFT_USERNAME%-observability-demo"...If you see your application and namespace, the COO Prometheus has successfully discovered and is scraping your ServiceMonitor. If not, verify the ServiceMonitor has the correct label:
oc get servicemonitor.monitoring.rhobs sample-app-coo -n %OPENSHIFT_USERNAME%-observability-demo --show-labelsYou should see
monitoring.rhobs/stack=observability-stackin the labels. -
Verify the pre-created Perses DataSource for the COO Prometheus:
A
PersesDatasourcenamedprometheushas been provisioned in your namespace as part of the workshop setup. It provides a shared connection to the COO Prometheus instance that all dashboards in your namespace can reference.oc get persesdatasource prometheus \ -n %OPENSHIFT_USERNAME%-observability-demo -o yamlExpected outputapiVersion: perses.dev/v1alpha1 kind: PersesDatasource metadata: name: prometheus namespace: %OPENSHIFT_USERNAME%-observability-demo spec: config: default: true display: name: "COO Prometheus" description: "COO MonitoringStack Prometheus in observability-demo" plugin: kind: PrometheusDatasource spec: proxy: kind: HTTPProxy spec: url: 'http://observability-stack-prometheus.observability-demo.svc.cluster.local:9090'The
default: truefield means that dashboards in your namespace which don’t specify a datasource name will automatically use this one. Dashboards that do reference it usename: prometheus. -
Create a Perses dashboard to visualize your metrics:
Now create a dashboard that references the datasource:
cat <<EOF | oc apply -f -
apiVersion: perses.dev/v1alpha1
kind: PersesDashboard
metadata:
  name: sample-app-dashboard
  namespace: %OPENSHIFT_USERNAME%-observability-demo
  labels:
    monitoring.rhobs/stack: observability-stack
spec:
  display:
    name: Sample Application Metrics
    description: HTTP request metrics for sample-app
  duration: 1h
  panels:
    httpRequestRate:
      kind: Panel
      spec:
        display:
          name: HTTP Request Rate
          description: HTTP request metrics for sample-app
        plugin:
          kind: TimeSeriesChart
          spec:
            yAxis:
              show: true
              label: ""
              format:
                unit: requests/sec
        queries:
          - kind: TimeSeriesQuery
            spec:
              plugin:
                kind: PrometheusTimeSeriesQuery
                spec:
                  datasource:
                    kind: PrometheusDatasource
                    name: prometheus
                  query: sum(rate(http_requests_total{namespace="%OPENSHIFT_USERNAME%-observability-demo"}[5m]))
                    by (pod)
    httpErrorRate:
      kind: Panel
      spec:
        display:
          name: Error Rate %
        plugin:
          kind: TimeSeriesChart
          spec:
            yAxis:
              show: true
              label: ""
              format:
                unit: percent-decimal
        queries:
          - kind: TimeSeriesQuery
            spec:
              plugin:
                kind: PrometheusTimeSeriesQuery
                spec:
                  datasource:
                    kind: PrometheusDatasource
                    name: prometheus
                  query: sum(rate(http_requests_total{namespace="%OPENSHIFT_USERNAME%-observability-demo",
                    code=~"[45].."}[5m])) by (pod)
    httpDuration:
      kind: Panel
      spec:
        display:
          name: Duration
        plugin:
          kind: TimeSeriesChart
          spec:
            legend:
              position: bottom
              mode: table
            yAxis:
              show: true
              label: ""
              format:
                unit: seconds
        queries:
          - kind: TimeSeriesQuery
            spec:
              plugin:
                kind: PrometheusTimeSeriesQuery
                spec:
                  datasource:
                    kind: PrometheusDatasource
                    name: prometheus
                  query: sum(rate(http_request_duration_seconds_sum{namespace="%OPENSHIFT_USERNAME%-observability-demo"}[5m]))
                    by (pod) /
                    sum(rate(http_request_duration_seconds_count{namespace="%OPENSHIFT_USERNAME%-observability-demo"}[5m]))
                    by (pod)
                  seriesNameFormat: Avg Latenct
          - kind: TimeSeriesQuery
            spec:
              plugin:
                kind: PrometheusTimeSeriesQuery
                spec:
                  datasource:
                    kind: PrometheusDatasource
                    name: prometheus
                  query: histogram_quantile(0.95,
                    sum(rate(http_request_duration_seconds_bucket{namespace="%OPENSHIFT_USERNAME%-observability-demo"}[5m]))
                    by (pod, le))
                  seriesNameFormat: P95 Latency
          - kind: TimeSeriesQuery
            spec:
              plugin:
                kind: PrometheusTimeSeriesQuery
                spec:
                  datasource:
                    kind: PrometheusDatasource
                    name: prometheus
                  query: histogram_quantile(0.99,
                    sum(rate(http_request_duration_seconds_bucket{namespace="%OPENSHIFT_USERNAME%-observability-demo"}[5m]))
                    by (pod, le))
                  seriesNameFormat: P99 Latency
  layouts:
    - kind: Grid
      spec:
        display:
          title: RED Metrics
          collapse:
            open: true
        items:
          - x: 0
            "y": 0
            width: 12
            height: 6
            content:
              \$ref: "#/spec/panels/httpRequestRate"
          - x: 12
            "y": 0
            width: 12
            height: 6
            content:
              \$ref: "#/spec/panels/httpErrorRate"
          - x: 0
            "y": 6
            width: 24
            height: 11
            content:
              \$ref: "#/spec/panels/httpDuration"
EOF
This creates a Perses dashboard with 2 panels that reference the shared datasource: request rate and total requests.
-
Generate traffic to populate the dashboard:
oc exec -n %OPENSHIFT_USERNAME%-observability-demo deployment/sample-app -c debug -- sh -c \
  'for i in $(seq 1 100); do
     r=$(od -An -N1 -tu1 /dev/urandom | tr -d " ");
     case $(( r % 10 )) in
       7|8) ep="/err" ;;
       9)   ep="/internal-err" ;;
       *)   ep="/" ;;
     esac;
     curl -s localhost:8080$ep > /dev/null;
     sleep $(awk "BEGIN{srand(); printf \"%.2f\\n\", rand() * 1.4 + 0.1}");
   done'
The mix of ~70% 200, ~20% 404, and ~10% 500 responses with random delays produces realistic traffic patterns — you will see separate time series per
codelabel in both dashboard panels. -
Access your custom dashboard in the OpenShift console:
-
Navigate to Observe → Dashboards (Perses) in the left navigation
-
In the dashboard dropdown, select Sample Application Metrics
-
You should see a Request Metrics section with 2 panels: HTTP Request Rate and Total HTTP Requests, each showing a time-series graph for your
sample-apppod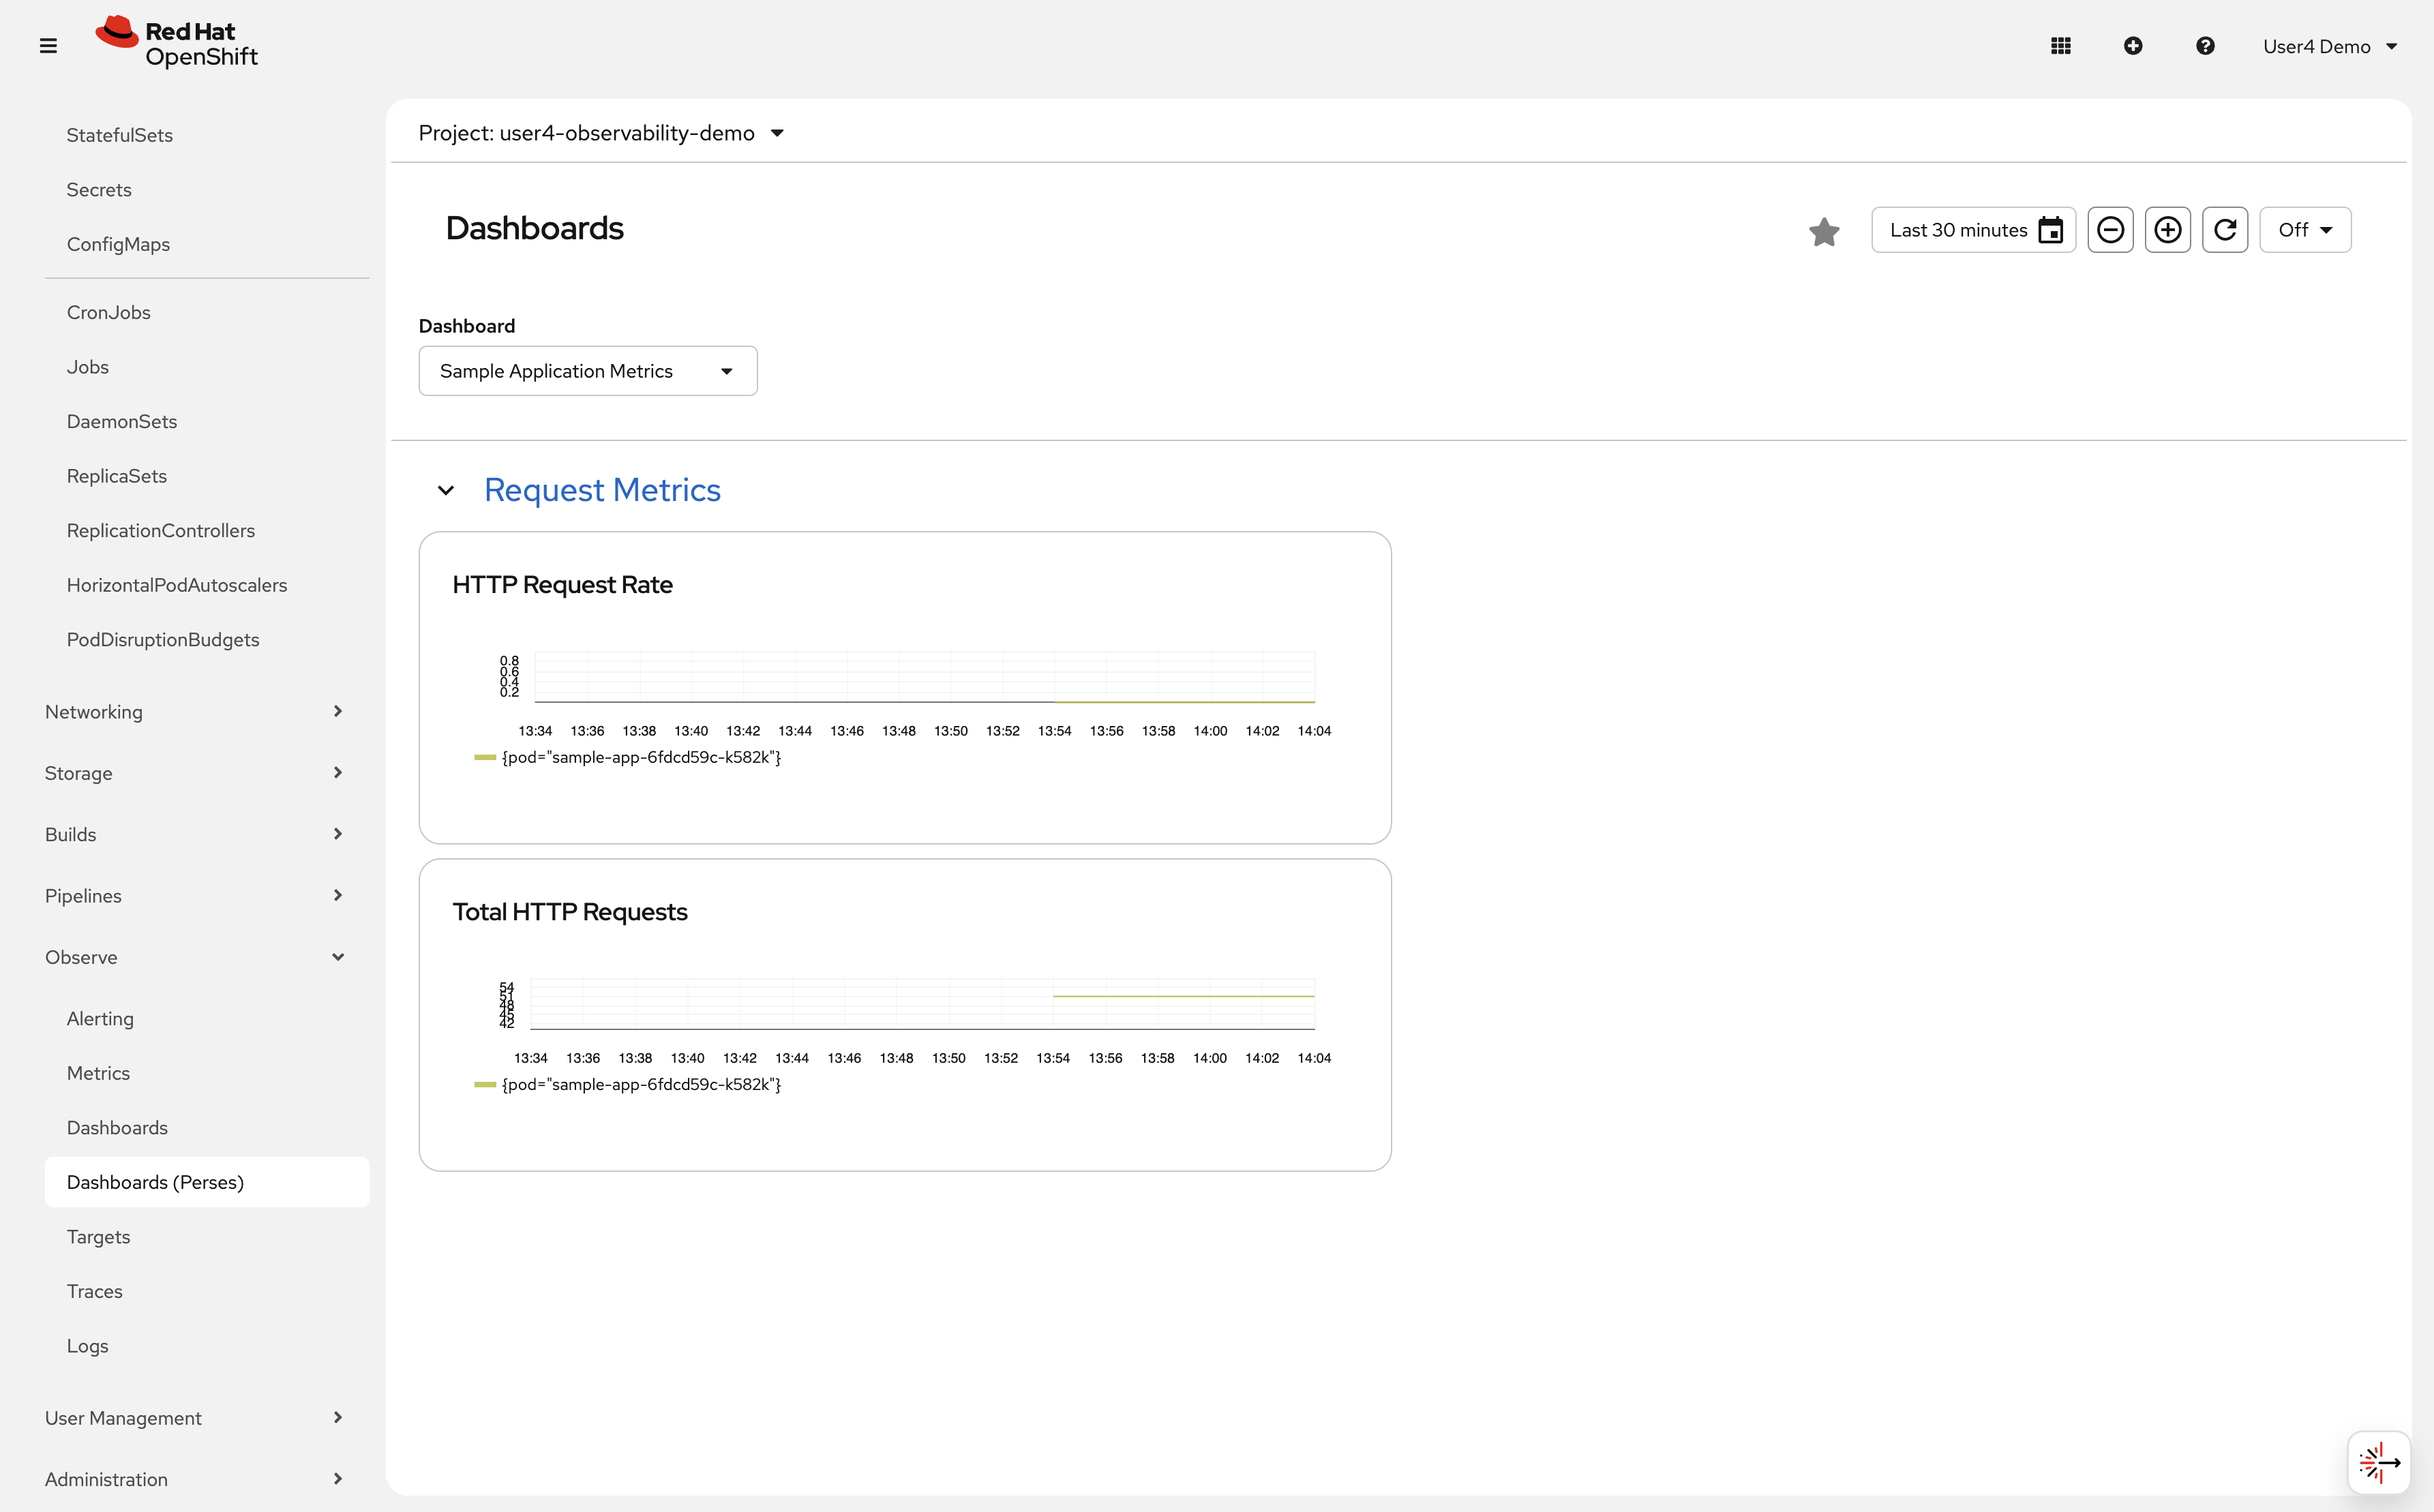
-
-
Verify the dashboard is using COO metrics:
The dashboard queries the COO Prometheus service in the
observability-demonamespace through the Perses datasource (not user workload monitoring). -
Explore and build dashboards with the standalone Perses UI:
A standalone Perses instance is available in the workshop environment for interactive dashboard creation. This is a great way to build and prototype dashboards visually before exporting them as YAML to apply to the cluster.
Navigate to the Perses UI at https://perses.%openshift_cluster_ingress_domain%
From the Perses UI you can:
-
Browse existing dashboards and datasources
-
Create new dashboards using the visual editor
-
Build and test PromQL queries interactively against the COO Prometheus
-
Export any dashboard as ready-to-apply Kubernetes YAML via Dashboard → Export → Download as YAML
The exported YAML can be applied directly with
oc apply -f, just remember to add themonitoring.rhobs/stack: observability-stacklabel so COO picks it up.The Perses standalone UI is a shared environment — use your %OPENSHIFT_USERNAME%prefix when naming dashboards to avoid conflicts with other workshop users.
-
Verify
Check that your COO dashboard is working:
-
✓ MonitoringStack exists in observability-demo namespace
-
✓ ServiceMonitor
sample-app-coohas labelmonitoring.rhobs/stack: observability-stack -
✓ PersesDatasource
prometheusexists in your namespace withdefault: true -
✓ PersesDashboard created successfully
-
✓ Dashboard appears in Observe → Dashboards
-
✓ Panels show request rate and total requests
-
✓ Graphs update with new data
What you learned:
-
COO is an independent operator that coexists with the Cluster Monitoring Operator (CMO)
-
MonitoringStack CR creates namespace-scoped monitoring with label-based ServiceMonitor discovery
-
COO provides multi-tenancy: different teams can have isolated monitoring stacks
-
Perses datasources are shared infrastructure—pre-created per namespace so dashboards can reference them by name
-
Perses dashboards are declarative (YAML) and versioned with your application
-
You can run multiple monitoring systems: cluster-wide (CMO) + team-scoped (COO)
-
COO offers more flexibility: longer retention, custom configurations, independent release cycles
-
Thanos Querier aggregates metrics from multiple Prometheus replicas for high availability
Troubleshooting
Issue: ServiceMonitor not picked up by COO
Solution:
. Verify the label: oc get servicemonitor sample-app-coo -n %OPENSHIFT_USERNAME%-observability-demo --show-labels
. Must have: monitoring.rhobs/stack=observability-stack
. Wait 1-2 minutes for Prometheus to discover the new ServiceMonitor after creation
Issue: PersesDatasource prometheus not found
Solution:
. The datasource is pre-provisioned by the workshop setup. If it is missing, contact the workshop facilitator.
. To verify it exists: oc get persesdatasource prometheus -n %OPENSHIFT_USERNAME%-observability-demo
Issue: Dashboard not visible in console
Solution:
. Verify PersesDashboard exists: oc get persesdashboard -n %OPENSHIFT_USERNAME%-observability-demo
. Check for errors: oc describe persesdashboard sample-app-dashboard -n %OPENSHIFT_USERNAME%-observability-demo
. Wait 1-2 minutes for the dashboard to appear in the console after creation
Issue: Dashboard shows "No data"
Solution:
. Wait 2-3 minutes for Prometheus to scrape metrics
. Verify Thanos Querier is running: oc get pods -n observability-demo -l app.kubernetes.io/name=thanos-querier
. Generate traffic (run the curl loop again)
. Check Prometheus targets: Port-forward to COO Prometheus and check /targets
Exercise 5: Configure alerting rules
Dashboards help you see current state, but alerts proactively notify you when problems occur. You’ll create an alerting rule that fires when request rates drop unexpectedly.
Steps
-
Create a PrometheusRule resource with an alerting rule:
cat <<EOF | oc apply -f -
apiVersion: monitoring.coreos.com/v1
kind: PrometheusRule
metadata:
  name: sample-app-alerts-%OPENSHIFT_USERNAME%
  namespace: %OPENSHIFT_USERNAME%-observability-demo
  labels:
    app: sample-app
spec:
  groups:
  - name: sample-app
    interval: 30s
    rules:
    - alert: LowRequestRate
      expr: sum(rate(http_requests_total{namespace="%OPENSHIFT_USERNAME%-observability-demo"}[5m])) < 0.1
      for: 2m
      labels:
        severity: warning
      annotations:
        summary: "Low request rate detected"
        description: "Application in namespace {{ \$labels.namespace }} is receiving fewer than 0.1 requests/second for more than 2 minutes."
EOF
This alert fires if request rate drops below 0.1 requests/second for more than 2 minutes.
-
Verify the PrometheusRule was created:
oc get prometheusrule -n %OPENSHIFT_USERNAME%-observability-demo -
Check alert status in the console:
Navigate to Observe → Alerting in the OpenShift console.
-
Click on the Alerting rules tab
-
Search for "LowRequestRate"
-
You should see the alert in Inactive or Pending state
-
-
Trigger the alert by stopping traffic:
Wait 2-3 minutes without generating any traffic. The alert should transition from Inactive → Pending → Firing.
-
Generate traffic to resolve the alert:
oc exec -n %OPENSHIFT_USERNAME%-observability-demo deployment/sample-app -c debug -- sh -c \
  'for i in $(seq 1 200); do
     r=$(od -An -N1 -tu1 /dev/urandom | tr -d " ");
     case $(( r % 10 )) in
       7|8) ep="/err" ;;
       9)   ep="/internal-err" ;;
       *)   ep="/" ;;
     esac;
     curl -s localhost:8080$ep > /dev/null;
     sleep $(awk "BEGIN{srand(); printf \"%.2f\\n\", rand() * 0.9 + 0.1}");
   done'
After a few minutes, the alert should transition back to Inactive.
Verify
Check that your alerting rules are working:
-
✓ PrometheusRule exists in %OPENSHIFT_USERNAME%-observability-demo namespace
-
✓ Alert appears in Observe → Alerting → Alerting rules
-
✓ Alert transitions through states: Inactive → Pending → Firing
-
✓ Alert resolves when traffic increases
What you learned: PrometheusRule resources define alerting conditions. Alerts transition through states (Inactive → Pending → Firing) based on PromQL expressions and duration thresholds.
Troubleshooting
Issue: Alert not visible in console
Solution:
. Verify PrometheusRule exists: oc get prometheusrule -n %OPENSHIFT_USERNAME%-observability-demo
. Check syntax errors in PromQL expression
. Wait 1-2 minutes for Prometheus to reload configuration
Issue: Alerting page shows Restricted access with prometheuses/api or alertmanagers/api forbidden
Solution:
. This indicates missing RBAC for monitoring API subresources used by the OpenShift console
. Ask a cluster admin to run make deploy (with cluster-admin credentials) so workshop monitoring API RoleBindings are applied
. Verify access after RBAC update:
+
oc auth can-i get prometheuses.monitoring.coreos.com/api -n openshift-user-workload-monitoring
oc auth can-i get alertmanagers.monitoring.coreos.com/api -n openshift-user-workload-monitoring-
Refresh the Alerting page after both checks return
yes
Issue: Alert never fires
Solution:
. Verify condition is met (request rate < 0.1/sec)
. Check for duration (must be in low state for 2 minutes)
. Generate traffic then stop to test alert firing
Learning outcomes
By completing this module, you should now understand:
-
✓ The 3 pillars of observability (metrics, logs, traces) and when to use each signal type
-
✓ Observability methodologies: RED (request-driven), USE (resources), Golden Signals
-
✓ OpenShift’s monitoring architecture: Platform (CMO), User Workload (CMO), and COO
-
✓ Cluster Observability Operator (COO): Independent multi-tenant monitoring with MonitoringStack CR
-
✓ How ServiceMonitor resources configure Prometheus to scrape application metrics
-
✓ Writing PromQL queries to analyze application performance and calculate rates
-
✓ Creating declarative Perses dashboards for custom visualizations with COO
-
✓ Configuring PrometheusRule resources to proactively alert on application issues
Business impact:
You’ve implemented the foundation of proactive monitoring. Instead of discovering issues through user complaints, you now have:
-
Real-time visibility into application request rates and patterns
-
Declarative dashboards versioned alongside your application code
-
Team-scoped monitoring (COO) isolated from cluster infrastructure monitoring
-
Automated alerts that notify you before problems impact customers
Next steps: Module 2 will add centralized logging with LokiStack, enabling you to correlate metrics with detailed log messages for faster root cause analysis.
Module summary
You successfully demonstrated how user workload monitoring provides application visibility.
What you accomplished:
-
Verified the user workload monitoring stack (Prometheus, Thanos, Alertmanager)
-
Deployed a sample application with Prometheus-compatible metrics
-
Configured ServiceMonitor to automatically collect application metrics
-
Created namespace-scoped monitoring with Cluster Observability Operator (COO)
-
Built declarative Perses dashboards to visualize application performance
-
Implemented alerting rules to proactively detect application issues
Key concepts mastered:
-
ServiceMonitor: Declaratively configures which services Prometheus scrapes
-
MonitoringStack: Namespace-scoped monitoring with label-based resource discovery
-
PromQL: Query language for analyzing time-series metrics data
-
PersesDashboard: Declarative YAML-based dashboard as code
-
PrometheusRule: Defines alerting conditions and notification thresholds
-
User workload monitoring vs COO: Cluster-wide vs namespace-scoped monitoring
Metrics collected:
-
http_requests_total: Counter of all HTTP requests by status code -
up: Target availability (1 = healthy, 0 = down) -
Custom application metrics from your deployed services
Continue to Module 2 to add centralized logging capabilities.